
Fig 5. S epitope candidates.
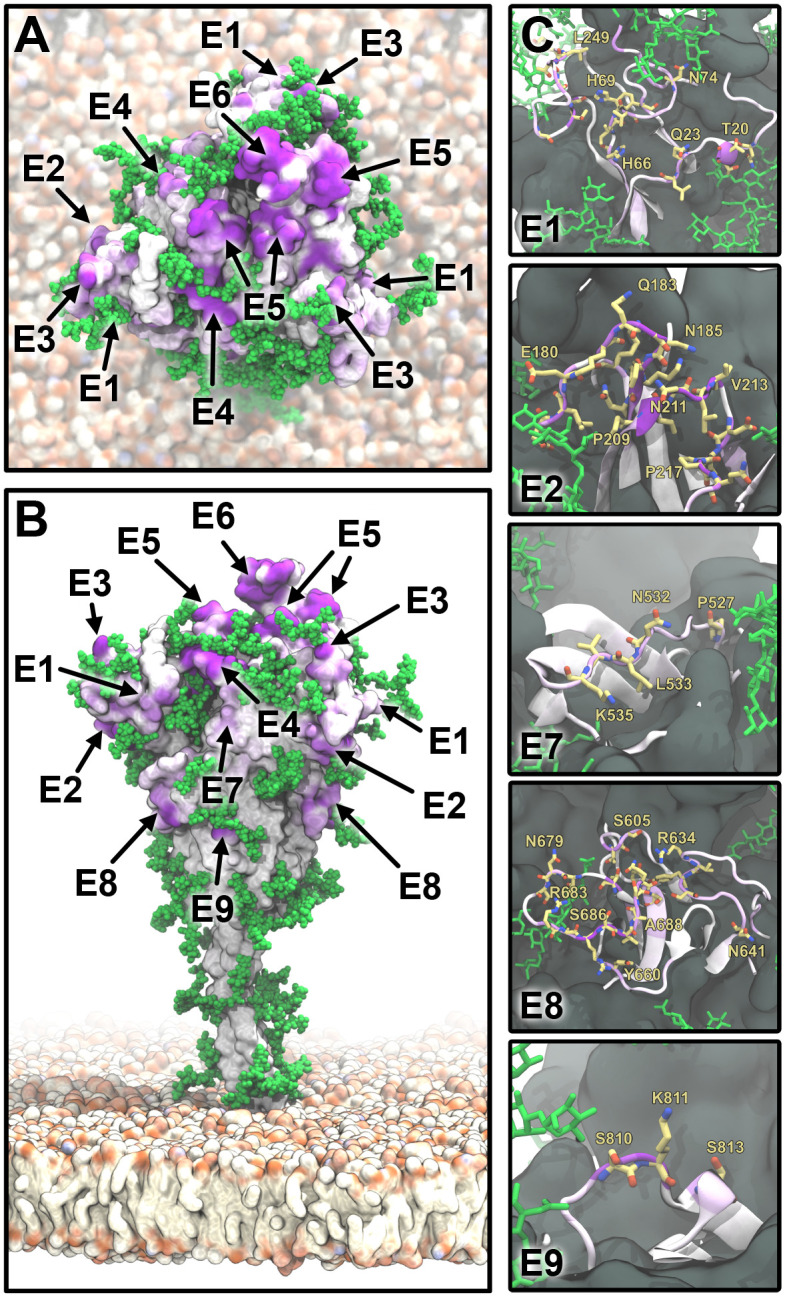
(A) Top view of S represented as in Fig 3F. Epitope candidates are labeled according to Table 1. (B) Side view with coloring and labels as in A. (C) Zoom-ins on epitope candidates (E1, E2, E7–E9) in a cartoon representation and colored as in A. Residues with an epitope consensus score >0.2 are shown in yellow licorice representation.