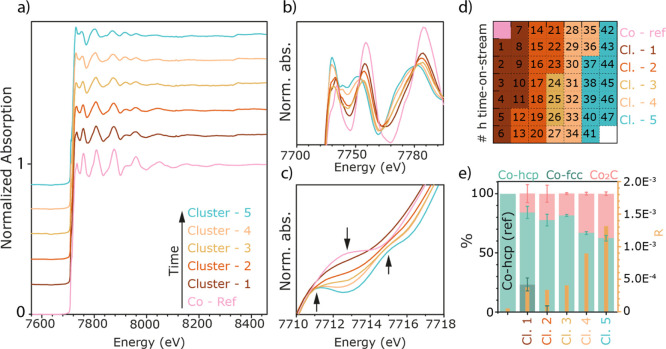
Figure 6.
PCA and clustering of the operando XAS data shown in Figure 5. With this method, the large number of spectra is downsized to five different clusters and a reference with TOS indicated in (a) (spectra offset for clarity). (b,c) A zoom-in of the areas with the most spectral changes. (d) The time frame of the different clusters with TOS. The colored boxes represent the cluster and the number represents the time in hours. The different clusters were fitted with the spectra of post-reduction, post-H2 treatment (post-H2), and the Co2C reference, and the linear combination result with the residual is shown in (e). With TOS, the amount of Co2C phase is increasing and metallic Co is decreasing.

