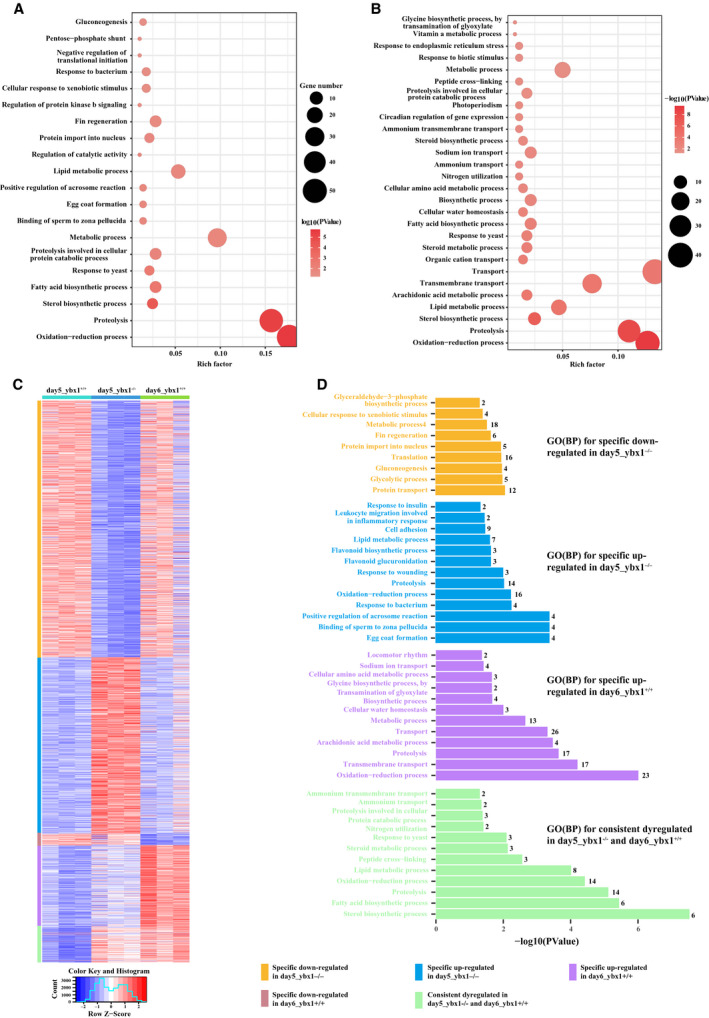
Fig. 2.

Differential expression analysis between day5_ybx1 +/+ and day5_ybx1 −/− and day6_ybx1 +/+. GO functional enrichment analysis of DE transcripts achieved on David server: (A) day5_ybx1 +/+ versus day5_ybx1 −/− and (B) day5_ybx1 +/+ versus day6_ybx1 +/+. The results are summarized only in the category of BP. The y axis indicates functional groups. The x axis indicates –log10 (P‐value). (C) Heatmap of all DE transcripts that were clustered into five subsets, including specific down‐regulated in day5_ybx1 −/−, specific up‐regulated in day5_ybx1 −/−, specific down‐regulated in day6_ybx1 +/+, specific up‐regulated in day6_ybx1 +/+ and consistently dysregulated in day5_ybx1 −/− and day6_ybx1 +/+. The expression profile was normalized using DESeq2 and then hierarchically clustered using heatmap2. Values have been centered and scaled for each row. Each row represents a single transcript. (D) Functional analysis of subsets using DAVID (FDR < 5%).
