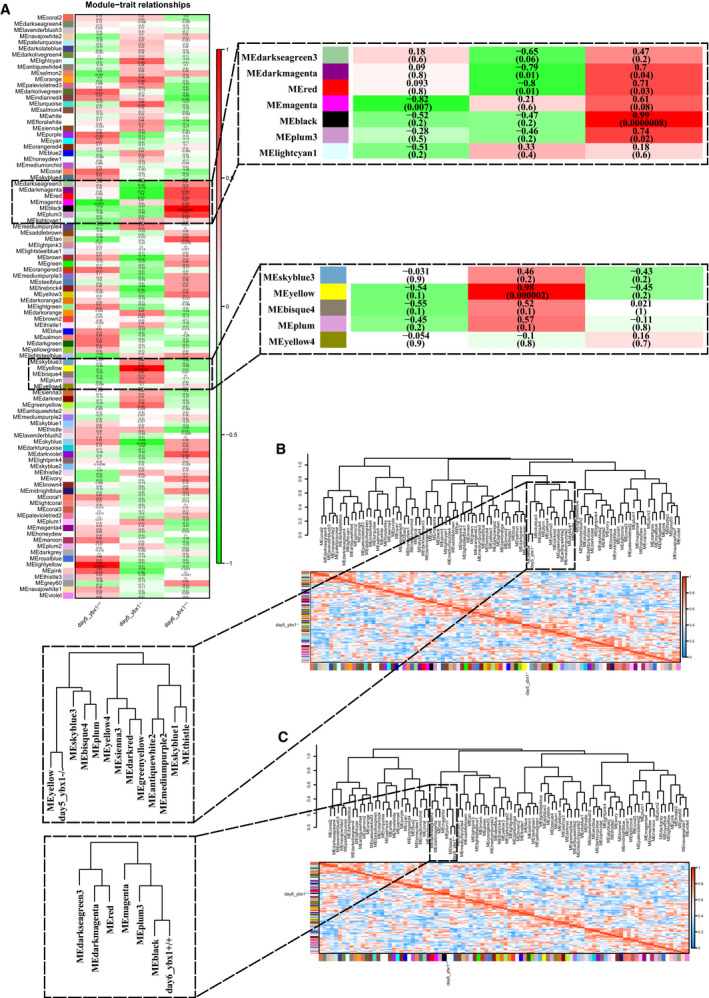
Fig. 3.

Detection of two trait‐related modules. (A) Module–trait associations. Each row corresponds to a module eigengene, and each column to a trait. Each cell displays the corresponding correlation and P‐value. (B) The eigengene dendrogram and heatmap identify that the yellow module is highly related to day5_ybx1 −/−. (C) The eigengene dendrogram and heatmap identify that the black module is highly related to day6_ybx1 +/+.
