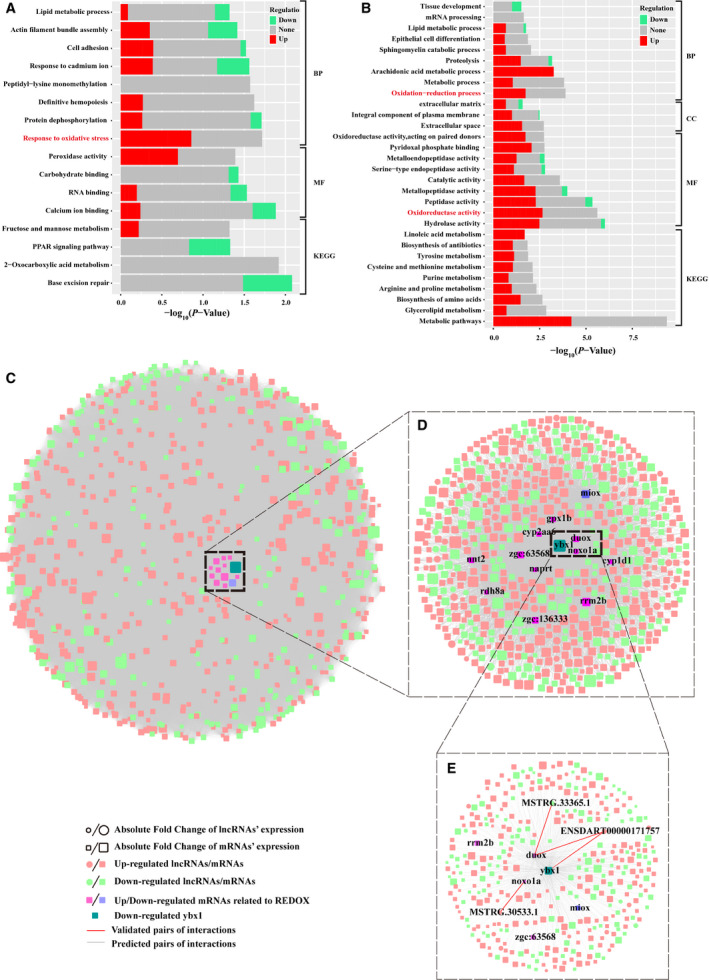
Fig. 4.

Coexpression network analysis defined REDOX‐related interactome in day5_ybx1 −/−‐related module. GO functional enrichment analysis of two trait‐related modules: (A) day5_ybx1 −/−‐related module and (B) day6_ybx1 +/+‐related module. The colored bar reports the fraction of up‐regulated and down‐regulated transcripts present in that functional category. All the adjusted statistically significant values of the terms were negative 10‐base log transformed. KEGG, Kyoto Encyclopedia of Genes and Genomes; BP, Biological Process; MF, Molecular Function; CC, Cellular Component (C) Cytoscape map of the interaction (including mRNA–mRNA, mRNA–lncRNA and lncRNA–lncRNA) network defined by DE lncRNAs and mRNAs using the function TOMsimilarityFromExpr of wgcna package. (D) A zoomed view of a core network displaying interactions (including mRNA–mRNA and mRNA–lncRNA) involved in REDOX‐related genes and YBX1. (E) Zoomed in subnetwork view of interactions involved in ybx1 and two key REDOX‐related genes: duox, noxo1a.
