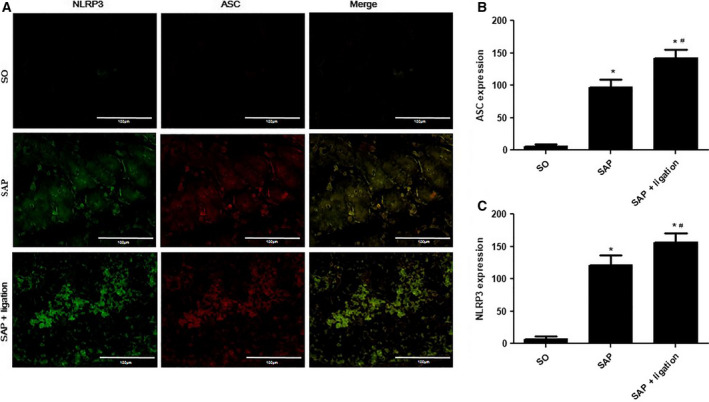
Fig. 5.

Effects of intestinal lymphatic ligation on the expressions of NLRP3 and ASC in the MLN cells in rats. The representative images of the uptake of NLRP3 and ASC in the intestine and mesenteric lymph nodes cells of rats (A) and summary results of bar graphs for each group (B and C). NLRP3 and ASC were determined by confocal laser scanning microscopy (400× magnification), positive expression of NLRP3 presented as green fluorescence, while positive expression of ASC presented as red fluorescence. The counts of positive expressions of ASC and NLRP3, the fluorescence expressions were counted at least 10 fields for each slide. Scale bars = 100 µm. There were six rats used for each experimental group (n = 6) and expressed as mean ± SD. P values were derived by LSD (L) test and Dunnett's T3 test. *P < 0.05 vs SO group; # P < 0.05 vs SAP group.
