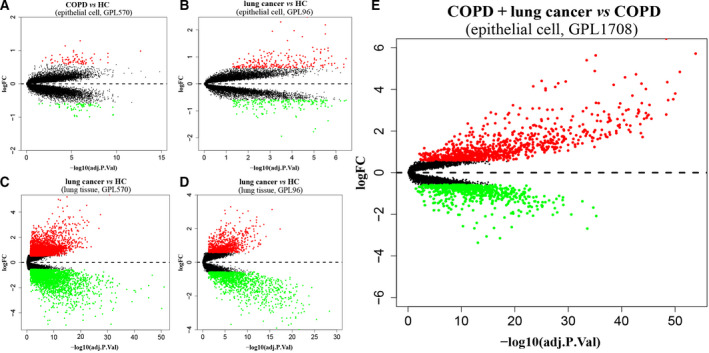
Fig. 1.

Volcano plots of DEGs. (A) COPD vs HC in epithelial cell of GPL570; (B) LC vs HC in epithelial cell of GPL96; (C) LC vs HC in lung tissue of GPL570; (D) LC vs HC in lung tissue of GPL96; (E) LC coexisting with COPD vs COPD in epithelial cell of GPL1708. Red and green dots denote up‐regulated and down‐regulated genes, respectively.
