Fig. 2.

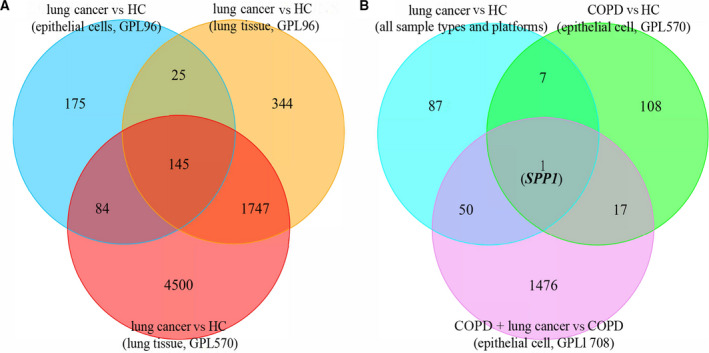
Venn diagrams of the DEGs. (A) The DEGs in LC vs HC across all sample types and platforms; (B) the overlapping DEG that was up‐regulated in patients with COPD, LC and LC coexisting with COPD.

Venn diagrams of the DEGs. (A) The DEGs in LC vs HC across all sample types and platforms; (B) the overlapping DEG that was up‐regulated in patients with COPD, LC and LC coexisting with COPD.