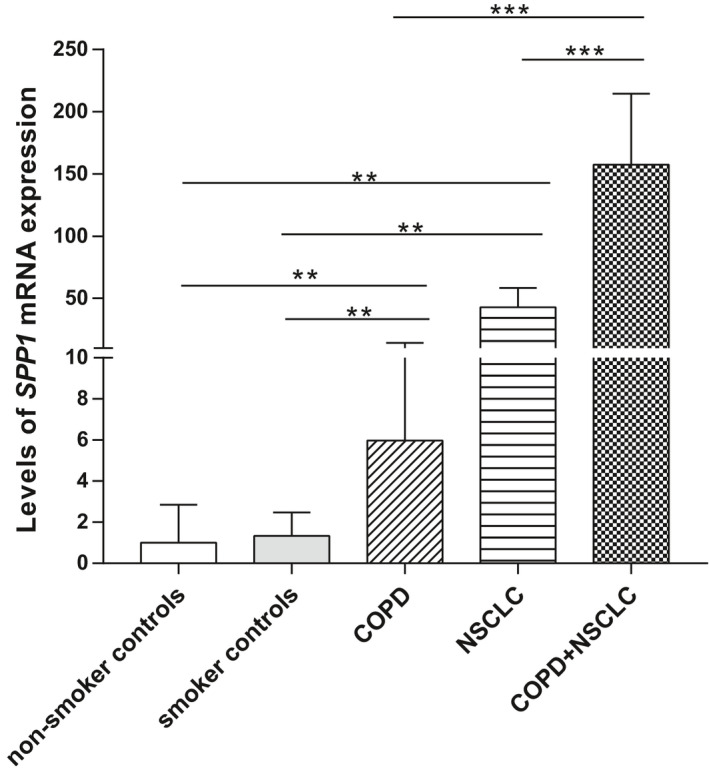
Fig. 7.

qPCR validation of SPP1 expression in a cancer cohort. Levels of SPP1 expression in lung tissues between non‐smoker controls (n = 9), smoker controls (n = 15), COPD (n = 13), NSCLC (n = 8) and NSCLC coexisting with COPD (n = 16) were compared by the Mann–Whitney test. Data are presented as median (interquartile range). **P < 0.01. ***P < 0.001.
