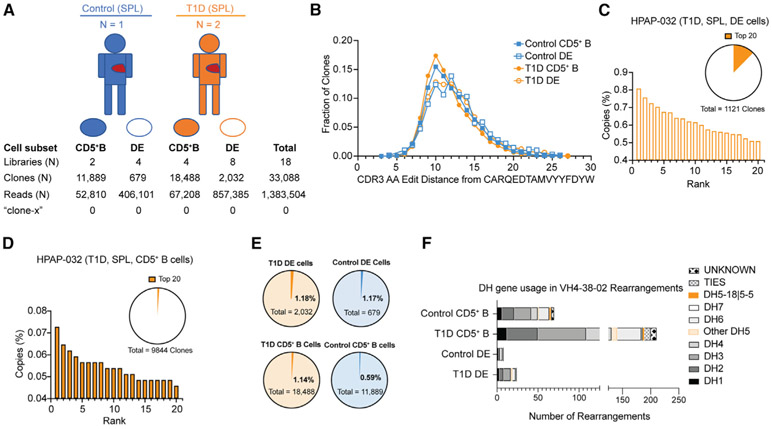
Figure 6. Antibody VH rearrangement data on sorted DE cells from T1D versus control subjects.
(A) Overview of study subjects and sorted B cell subsets from organ donor spleen (SPL). CD5+ B cells are CD5+, CD19+, TCRαβ− lymphocytes. DE, double expresser cells are TCRαβ+, CD19+, CD5+ lymphocytes. Libraries, clones, and reads (copies) are as defined in Figure 4.
(B) Levenshtein distance distribution of sorted cells, by population and disease status.
(C and D) (C) Copy-number percent of top 20 clones in the DE and (D) CD5+ B cell sorts. Orange wedges in pie charts show percentage of total library copies taken up by the top 20 clones. None of the clones in the top 20 copy number rearrangements in HPAP-032 had VH4-38-02 rearrangements (data on the other two donors are in Figure S7).
(E and F) (E) Fractions of clones with VH4-38-02 rearrangements from sorted DE and CD5+ B cells; (F) DH gene usage for VH4-38-02 rearrangements in sorted subsets. DH gene usage is shown, with each unique rearrangement only counted once. DH gene usage is given by family, except for DH5-18∣5-5, where sequences with this specific DH gene assignment are highlighted in orange. “Other DH5” indicates a DH5 gene other than DH5-18∣5-5. TIES indicate DH genes with more than one DH family assignment. UNKNOWN indicates no DH gene assignment. For (B), (E), and (F), the data for HPAP-015 and HPAP-032 were combined for T1D and HPAP-017 was the control. Each symbol is an individual. ns, not significant by Mann-Whitney rank sum test, α = 0.01.

