. 2021 Apr 1;129(4):047002. doi: 10.1289/EHP7886

Figure 4.

Figure 4 is a set of four line graphs plotting Mean risk of illness from Severe acute respiratory syndrome coronavirus 2, ranging as 10 begin superscript negative 4 end superscript, 0.001 to 0.010 in increments of 0.009, 0.010 to 0.100 in increments of 0.09, and 0.100 to 1 in increments of 0.9 (y-axis) across symptoms, ranging from 7 to 11 in unit increments (x-axis) for Sneeze-High, Sneeze-Low, Cough-High, Cough-Low, Sing, Speak-High, Speak-Low, and Breathe with 20 minutes, no ventilation, 2 hours, no ventilation, 2 hours, 1 air exchange per hour, and 2 hours, 6 air exchanges per hour, respectively.

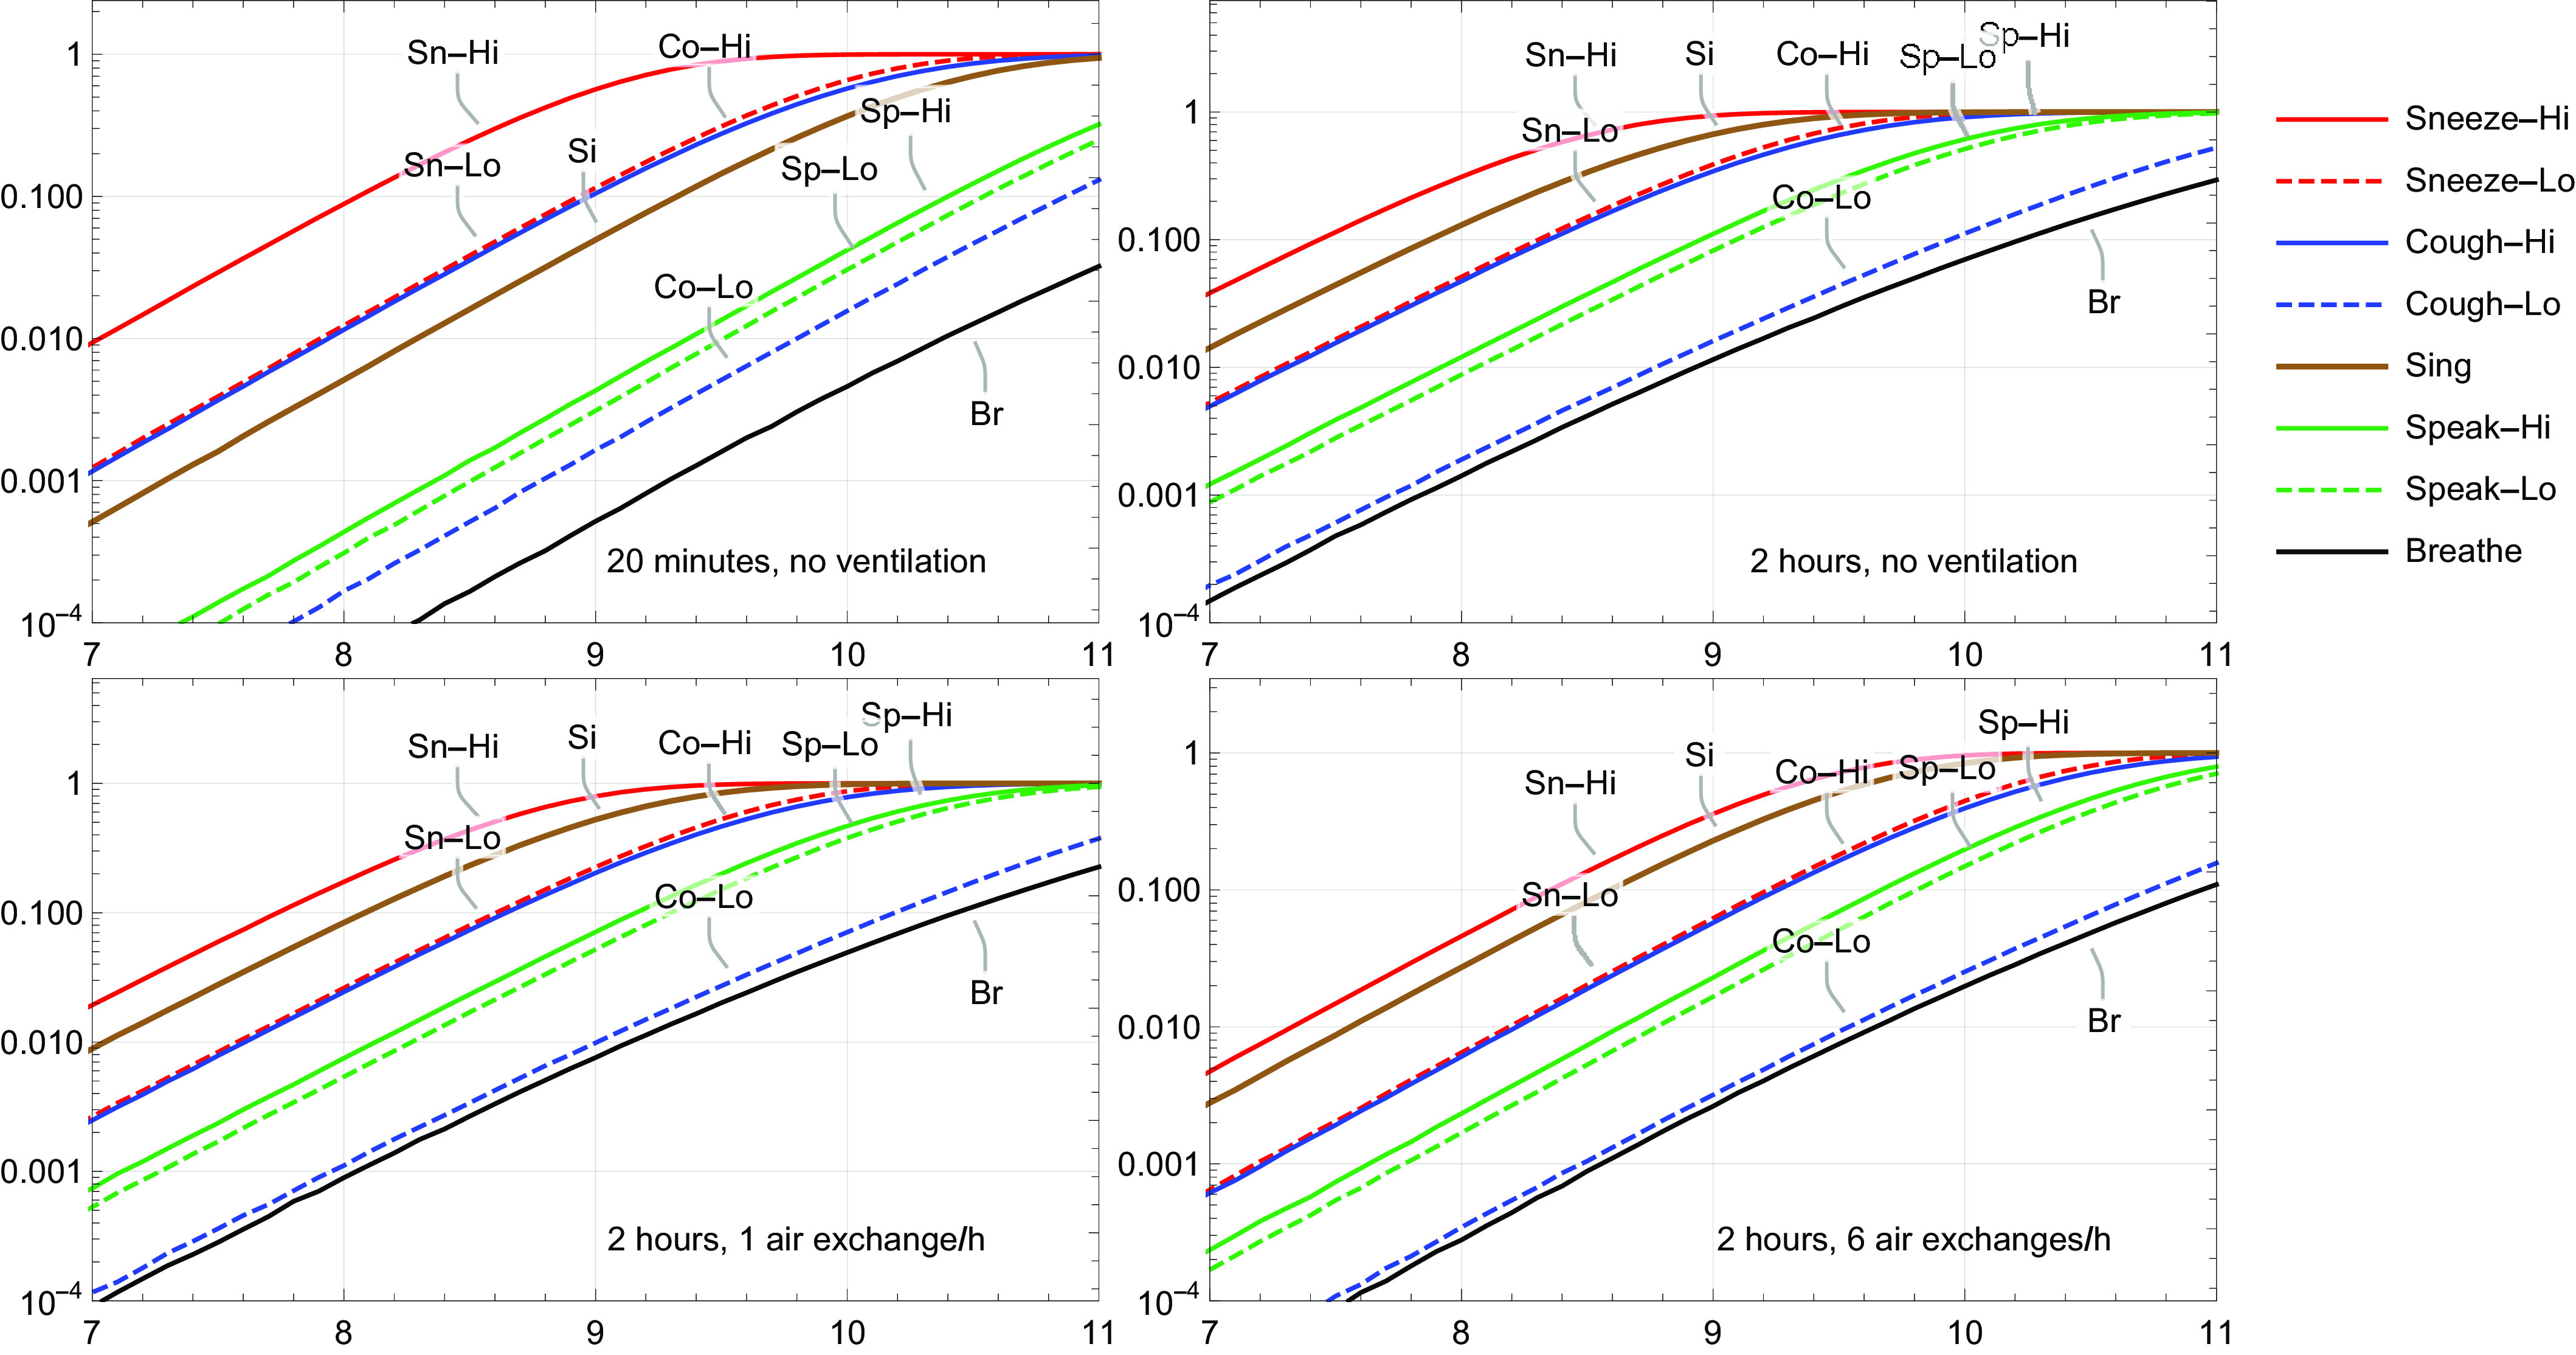
Mean risk of illness from SARS-CoV-2 for different scenarios, in which one infected person was expelling virus for 20 min or 2 h, without or with ventilation. The probability that a contagious person at the onset of symptoms is expelling at least 106, 107, 108, 109, 1010, or 1011 RNA copies/mL was estimated to be 88%, 66%, 36%, 13%, 2.7%, and 0.34%, respectively. Lo and Hi denote low and high aerosol volume relative to each other.