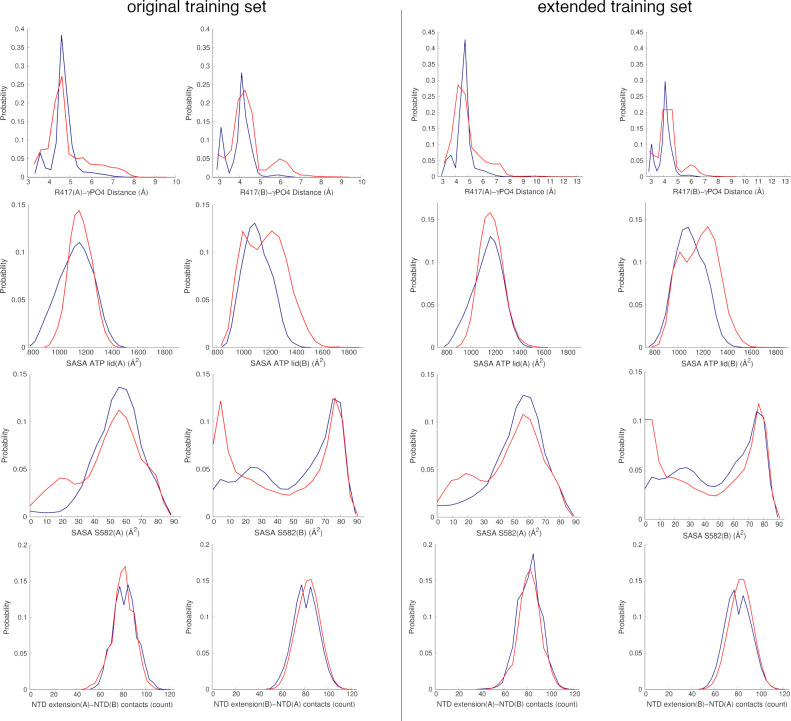
Figure 2.
Probability distributions for the eight features in TRAP1 states A (blue) and I (red) in original (720 ns for each state A/I) and extended training sets (2.52 μs for each state A/I). The plots were obtained distributing individual features vectors collected from 9 inhibitor-unbound replicates and 9 inhibitor-bound complexes containing compounds (5–7) with the highest inhibitory efficacy in the allosteric site (see Table 1).

