Figure 3.
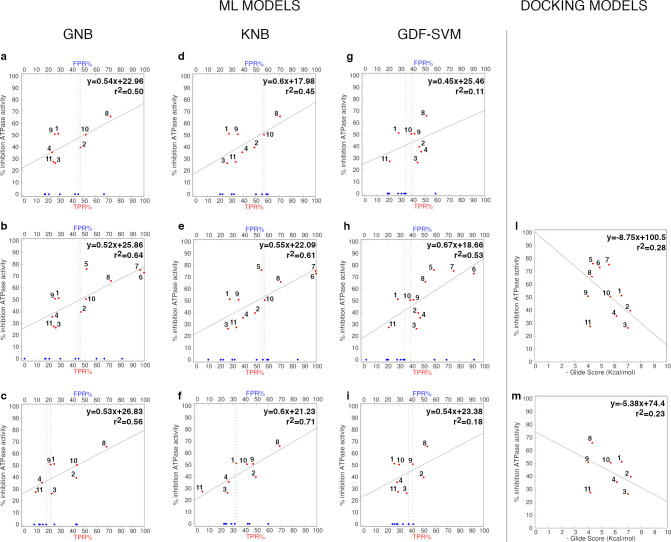
External validation of GNB, KNB and GDF-SVM models against small and large test sets. Predicted TPR percentage (TPR%, red dots) for the 8 ligands (a, c, d, f, g, i) or 11 ligands (b, e, h) against observed percentage of TRAP1 inhibition. In each plot, FPR percentage (FPR%) are calculated as the percentage of states I in the same number of inhibitor-free systems. ML models validated on the original training set (a, d, g) and the extended training set (c, f, i) were used for predictions. The original training set was also tested on “unseen” trajectories of compounds 5–7 (large test set) (b, e, h). Regression lines are shown in solid gray lines, with the associated equations and r2 values. Ligands are numbered as in Table 4. Dashed gray lines identify boundaries between A/I states: the first line from the left passes through the blue point that defines the maximum FPR% found in at least 62.5% of inhibitor-free trajectories; the second line from the left goes through the first TPR% point (red) found immediately after the first boundary and delimits a region where predicted states I in the inhibitor-bound trajectories (TPR%) is significantly greater than the threshold of states I characterizing the inhibitor-free trajectories (FPR%). Regression models built from docking scores on the small (l) and large (m) test set are shown for comparison.

