Figure 3.

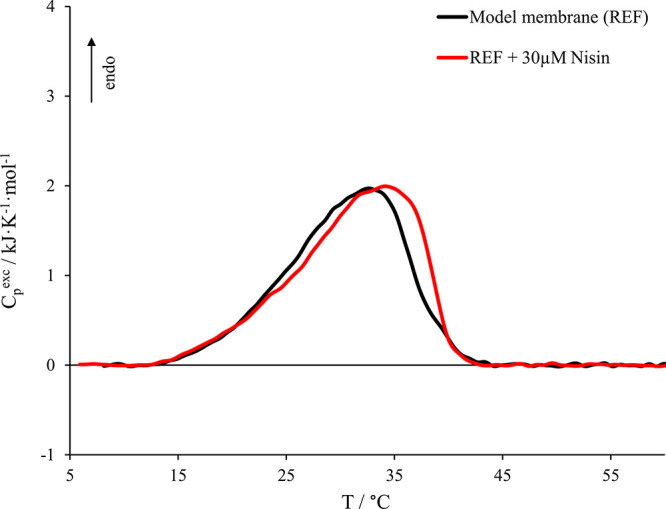
Micro-DSC profile in the presence of 30 μM nisin (red curve). Nisin:phospholipid molar ratio was 1:100. The model membrane alone (black curve) is also reported here for comparison.

Micro-DSC profile in the presence of 30 μM nisin (red curve). Nisin:phospholipid molar ratio was 1:100. The model membrane alone (black curve) is also reported here for comparison.