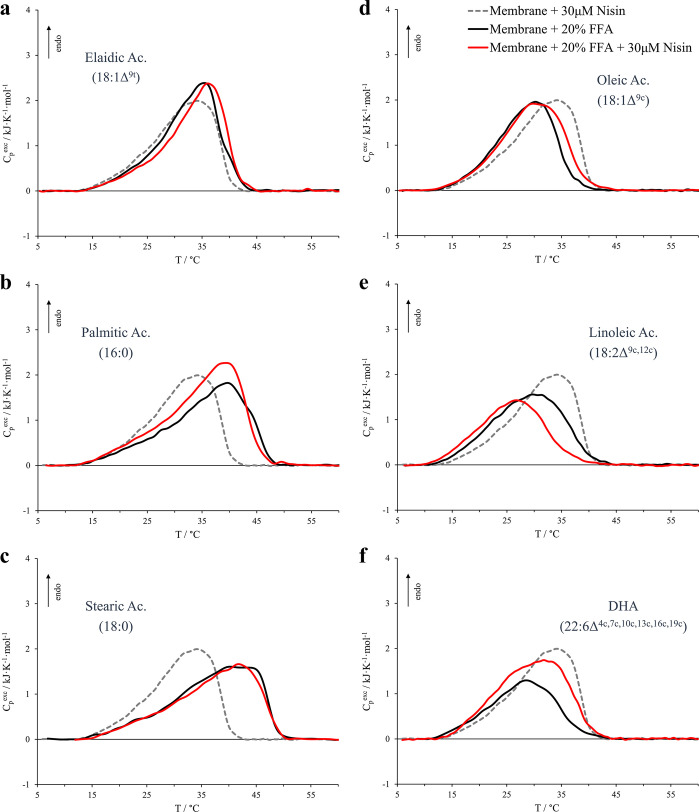
Figure 4.
Micro-DSC profiles for model membrane containing 20% different FFAs (black curves) and for the same vesicles in the presence of 30 μM nisin (red curves). The FFAs considered are (a) elaidic acid, (b) palmitic acid, (c) stearic acid, (d) oleic acid, (e) linoleic acid, and (f) docosahexaenoic acid (DHA). The profile of the FFAs-free membrane in the presence of 30 μM nisin is also represented for comparison by the dashed gray trace. Nisin:phospholipid molar ratio was 1:100.

