
Figure 2.
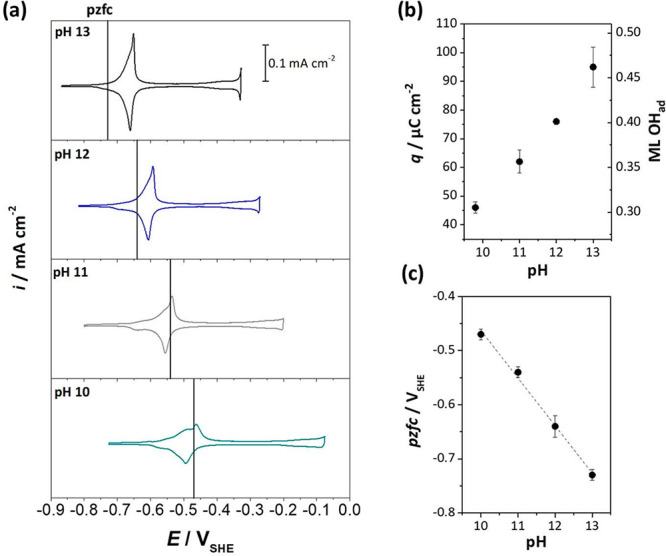
Interdependence of the potential of zero free charge (pzfc) and current versus potential cycles. (a) Cyclic voltammograms (CVs) of Cu(111) in 0.1 M NaClO4 at different pH values showing the electrochemical behavior in the potential range between −0.9 VSHE and 0.0 VSHE (scan rate: 50 mV s–1). The observed peak pairs correspond to the adsorption and desorption of OH– ions from the alkaline solutions. The vertical lines mark the positions of the pzfc. Dependence of (b) the estimated charge, i.e. the coverage with apparent OH monolayers, and (c) the pzfc on the pH. The error bar in (b) is determined through averaging of the charges of at least 3 CVs; the error bars in (c) correspond to the widths of the x-axis intercepts determined from Figure 3a–d.