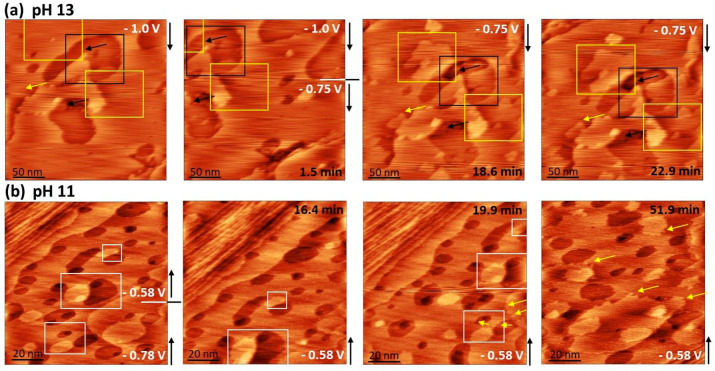
Figure 4.
EC-STM imaging to visualize structural and morphological changes at the pzfc. Time- and potential-dependent sequences of EC-STM images at pH 13 (a) and pH 11 (b). The morphology of the surface undergoes gradual changes, which are highlighted with black (vacancy island formation) and yellow (island formation) squares and arrows in (a), marking the position of identical spots on the surface that slightly move due to a drift in the images. The white boxes in (b) mark identical spots, while yellow arrows point to morphologically changed step edges. (a) Size = (250 × 250) nm2. (b) Size = (100 × 100) nm2, Itip = 1 nA, Etip = −0.40 VSHE.

