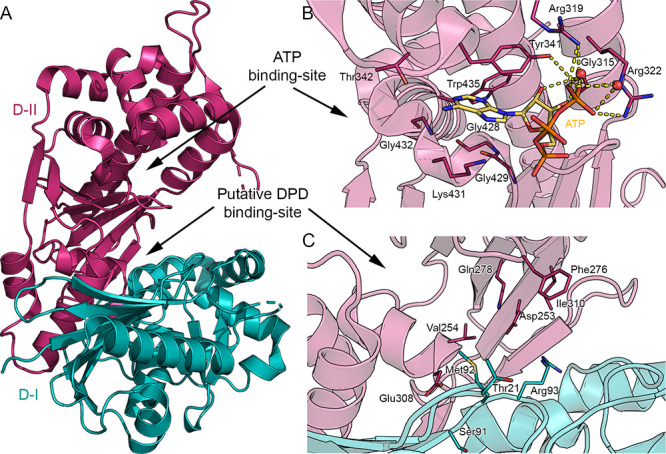
Figure 5.

(A) Crystal structure of the LsrK (PDB 5YA1). The two domains D-I and D-II of Lsrk, are visualized as cartoons in teal and magenta, respectively. (B) Close-up of the ATP binding site. ATP is represented in stick mode, with carbon atoms in yellow. (C) Close-up of the putative DPD binding site. Amino acid residues are visualized in stick mode with D-I’s and D-II’s carbon atoms in teal and magenta, respectively. Yellow dashed lines represent the hydrogen bonds. Heteroatoms are color-coded (oxygen atoms in red, nitrogen atoms in blue, sulfur atoms in yellow, phosphorus atoms in orange).
