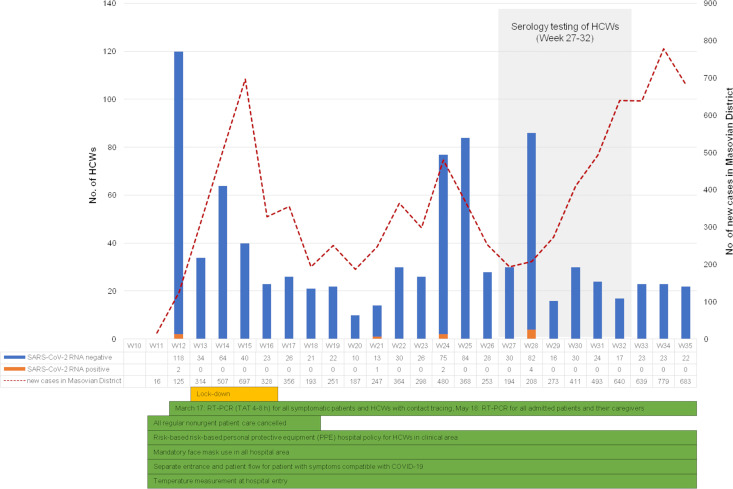
Fig 1. A weekly timeline of the COVID-19 epidemic.
The epidemic curve is shown as the number of HCWs tested each week for SARS-CoV-2 RNA by RT-PCR at the CMHI together with the number of new SARS-CoV-2 cases recorded in the Masovian district. The first SARS-CoV-2-positive case among HCWs of the CMHI was detected on March 17, 2020. Voluntary serological testing for HCWs of the CMHI was conducted from July 1 to August 9, 2020 (corresponding to week 27 and 32). Details of infection prevention and control measures implemented at the CMHI together with the nationwide lockdown, are given below the graph.

