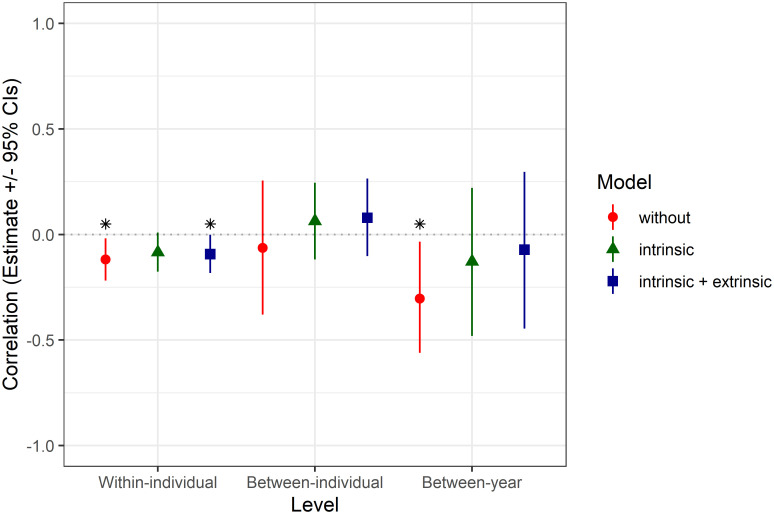
Fig 5. Correlations between δ13Coto and growth increment width (mean value and 95% credible intervals) estimated within-individual, between-individual, and between-years with the models incorporating different sets of effects (indicated with colors).
Significant correlations where credible intervals do not overlap zero are indicated with asterisks.

