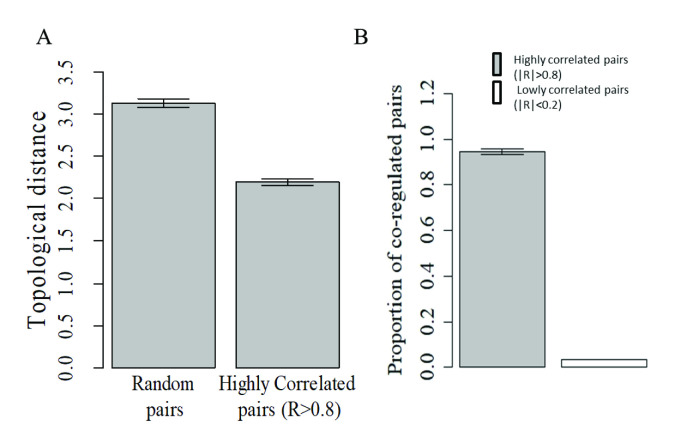
Fig 5. Correlated pairs of genes share common regulators in synthetic GRN.
A) Typical average topological distance (a measure of regulatory proximity in the GRN) between pairs of highly correlated genes (/R/ > 0.8) compared with the average distance between random pairs of background genes in the synthetic regulatory network. In both cases, the associated p value in a T test was below 10–16. B) Bar chart showing the average proportion (±S.E.M) of pairs of genes sharing a common regulator among either highly correlated pairs (/R/ >0.8) or lowly correlated pairs (/R/ < 0.2) found in 1000 independent simulations.

