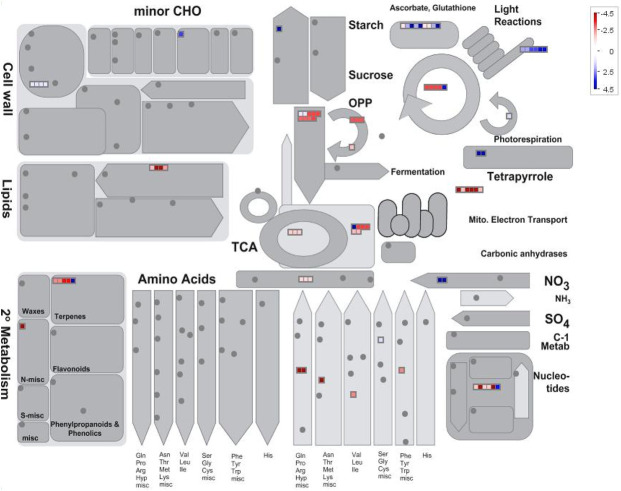
Fig 5. Mapman batch classification of proteins relating to metabolism in trichome heads vs late flowers.
Fold change differences in a protein’s abundance is indicated by the legend key where blue represents proteins more abundant in late- stage flowers, white indicates no change in a proteins abundance, and red indicates proteins found more abundant in glandular trichome heads.

