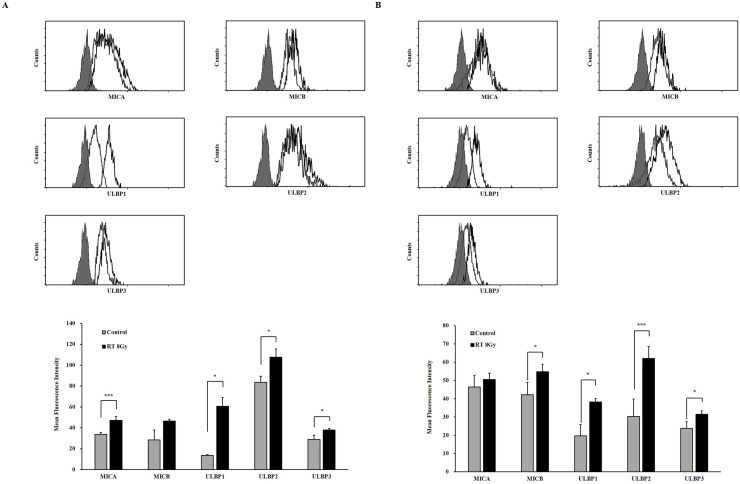
Fig 2.
Induced surface expression of NKG2D ligands in (A) A375P and (B) SK-MEL-28 melanoma cells by ionizing radiation. The upper panels show a representative flow cytometry data (filled gray–isotype; gray line–control; black line– 8Gy) and the lower panels show MFIs (gray–control; black– 8Gy). The experiments were performed three times. (p < 0.05, *; p < 0.001, ***).

