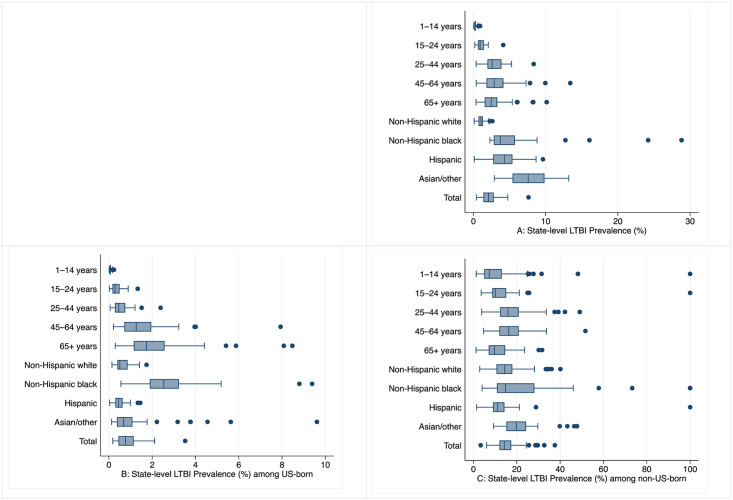
Fig 2. Distribution of estimated state-level prevalence of latent tuberculosis infection (LTBI), within age group and race/ethnicity populations, in 50 U.S. states and District of Columbia, 2015.
Box plot A shows total population LTBI estimates for each state. Box plot B shows LTBI prevalence estimate among US-born persons. Box plot C shows LTBI prevalence estimate among non-US–born persons. Dots represent the states with outlier estimates for LTBI prevalence.

