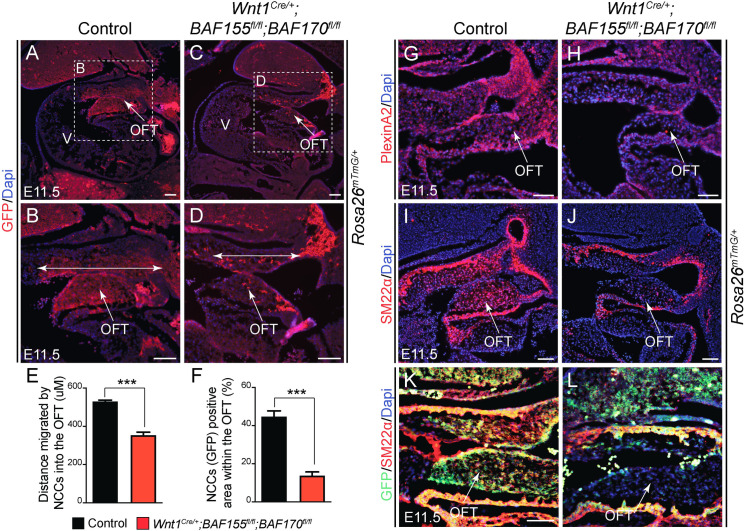
Fig 4. Impaired NCCs contribution to the developing cardiac outflow tract (OFT) of the neural crest-specific BAF155/170 mutant embryos.
(A-D) Lineage tracing of Wnt1Cre/+-derived cardiac NCCs using R26mTmG/+ reporter in E11.5 control and BAF155/170-deficient (Wnt1Cre/+;BAF155fl/fl;BAF170fl/fl) embryos. Anti-GFP immunostaining on the sagittal sections showing recruited cardiac NCCs in the OFT of control (A-B) and BAF155/170-deficient (C-D) embryos. Nuclei were visualized by Dapi staining (blue). Double head arrows show the distance of migrated cardiac NCCs in the OFT (B and D). (E) Quantification of distance migrated by NCCs into the OFT (n = 3). (F) Quantification of GFP+ neural crest cell area in the OFT (n = 3). (G-H) anti-PlexinA2 immunostaining and Dapi counterstaining on the OFT sections of control (E) and BAF155/170-deficient (F) embryos. (I-J) anti-SM22α immunostaining and Dapi counterstaining on OFT sections of control (G) and BAF155/170-deficient (H) embryos. (K-L) Double immunostaining for GFP and SM22α on OFT sections of control (K) and BAF155/170-deficient (L) embryos. (n = 3–4 each genotype). Values are reported as means ± SEM (*P < 0.05, **P < 0.01, ***P < 0.001; NS, not significant). Scale bar 75μM (A-L). OFT, outflow tract; V, ventricle.

