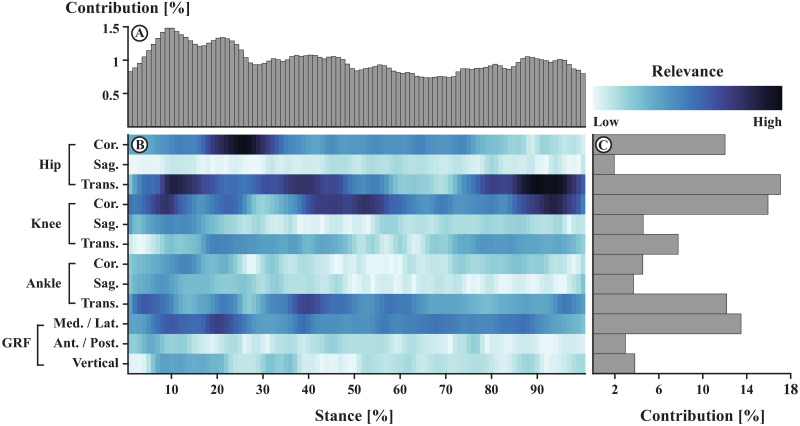
Fig 2. Absolute relevance of each variable within a stride pattern averaged across all relevance patterns.
The top part (A) shows the summed contribution of relevance for each of the 100 time points of stance. In the center (B), darker colors indicate variables of high relevance, while lighter colors indicate variables of low relevance. In other words, to assign a stride pattern to the respective participant, the model relied more on variables with darker shades. Variables with lighter shades were less relevant for a correct classification of gait patterns. The right part of the figure (C) highlights the summed contribution of relevance of each direction of joint angle trajectories.

