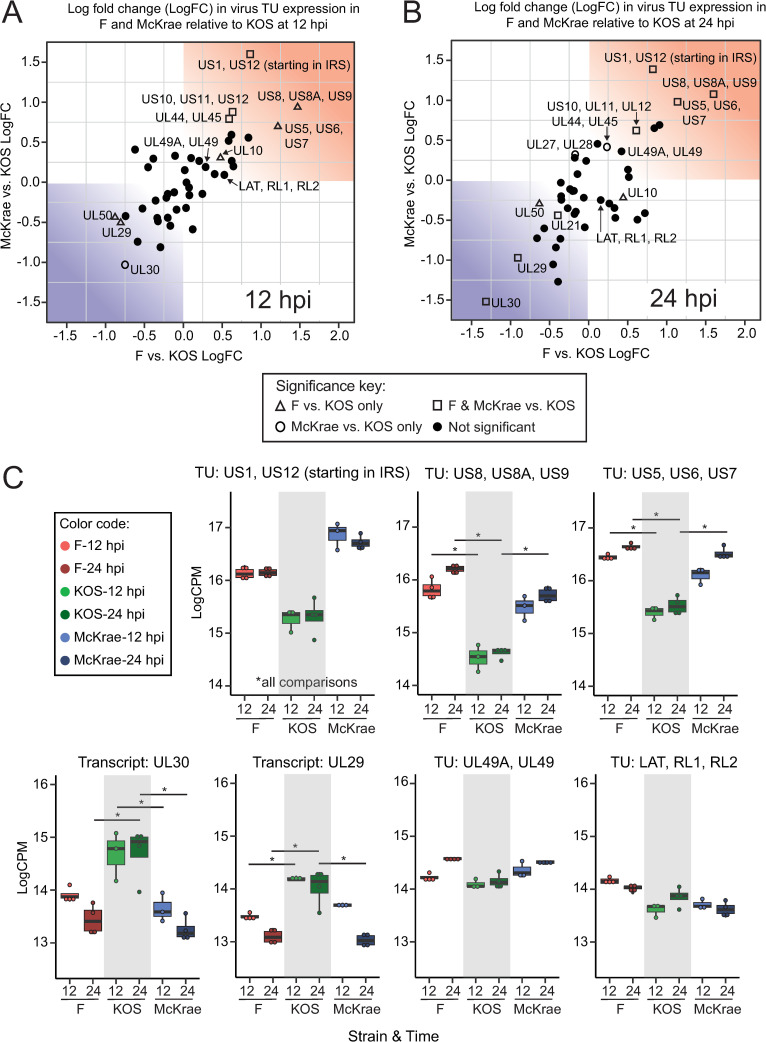
Fig 4. Visualization of individual viral transcripts and transcriptional units (TUs) highlights specific genes that exhibit differences in expression between strains.
Scatterplots graphically depict the log2fold change (logFC) of HSV-1 strains F vs. KOS (x-axis) relative to strains McKrae vs. KOS (y-axis). These data are plotted separately for (A) 12 hpi or (B) 24 hpi. The upper right quadrant of each graph (shaded in red) depicts TUs that show higher expression in strains F or McKrae relative to KOS, while the bottom right quadrant (shaded in blue) shows those TUs that are lower in expression in F or McKrae compared to KOS. HSV-1 strains McKrae and F have more similar transcriptional profiles to each other than to strain KOS. Using a quasi-likelihood F-test, 11 TUs were found to be statistically significant (p<0.05, FDR<0.05) in two or more comparisons. These are highlighted as open triangles, squares, or circles (see key). (C) Examples of each class of TU are individually plotted to highlight particular differences in transcription between strains. The top row shows TUs from the red quadrant, which have higher expression in strains McKrae and/or F than KOS. The bottom left plots show TUs from the blue quadrant (UL30, UL29), where expression in KOS is higher than in F and/or McKrae strains. Finally the bottom right plots illustrate TUs for which no statistical significance in expression levels between strains was detected. Box plots show median, quartile ranges, and individual data points.

