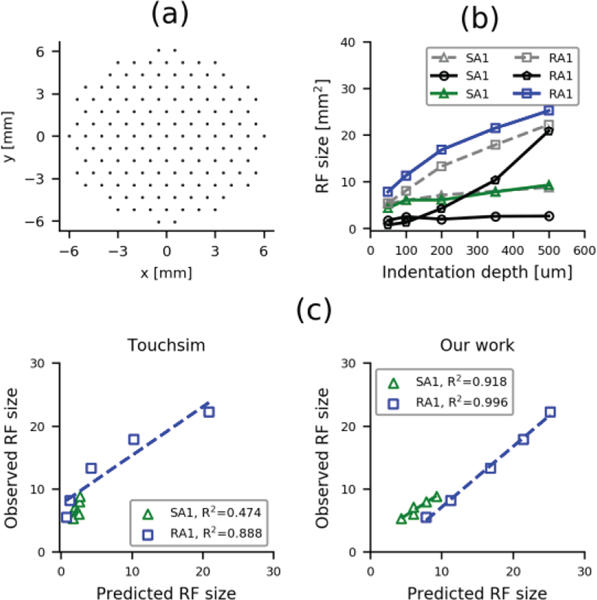
Fig. 6.
(a) Probe presentation locations relative to the tactile afferent location. (b) Receptive field size as a function of the relative indentation amplitude for SA1 and RA1 afferents from the current model (green & blue lines), from a recent model (black lines, adapted from [13]) and from the observed data (gray dashed lines, adapted from [30]). (c) Relationship between the observed and predicted RF sizes using the TouchSim model [13] (left panel) and our model (right panel). Dashed lines denote best fits.

