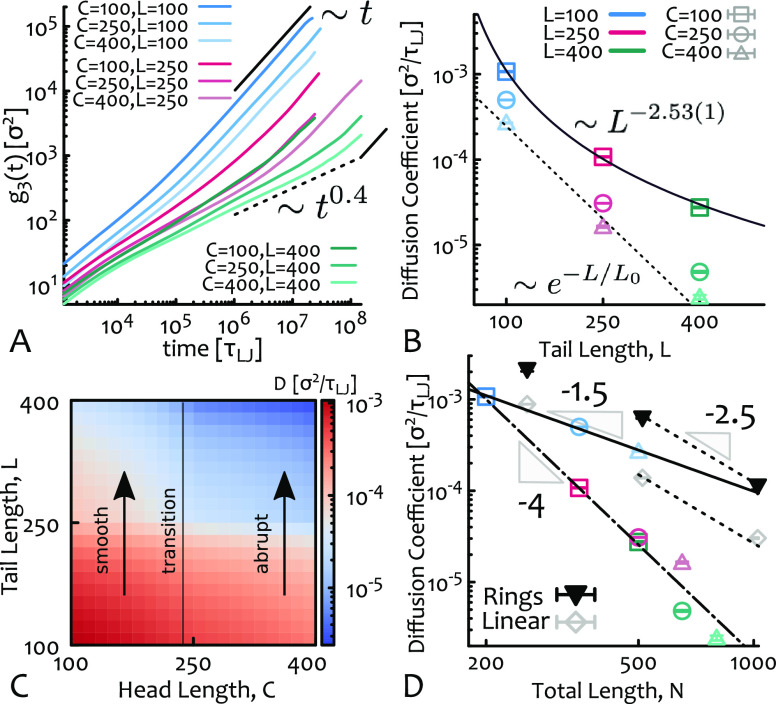
Figure 2.
(A) Mean-square displacement of the center of mass, g3(t), of the tadpoles. (B) Log–linear plot of long-time diffusion coefficient D against tail length L. The data set with C = 100 is well fitted by a power law ∼L–a with a = 2.53(1), while tadpoles with larger heads display a qualitatively different slowing down with a = a(L) increasing with tail size and compatible with an exponential (shown as a dashed line as a guide for the eye). (C) Interpolated heat map of D in the 2D parameter space (C, L). (D) Plot of D against total contour length and compared with the dynamics of pure linear and ring polymers. The solid, dashed, and dashed-dotted lines are guides for the eye. The dashed line indicates the known scaling for asymptotic ring and linear chains.13 Note that D(L = 400, C = 400) is an upper bound value as the system has not reached free diffusion within our longest simulation runtime.

