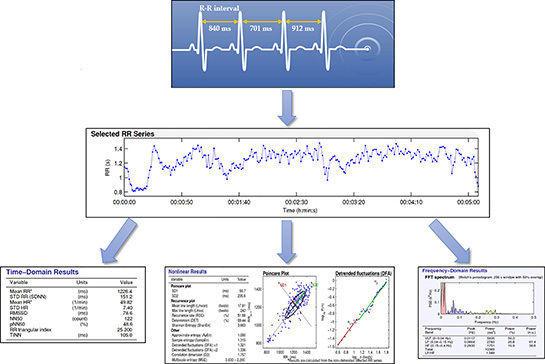
Figure 5: Heart rate variability analysis. After proper identification of RR intervals from electrocardiogram trace (top picture), the measured time of each RR interval is plotted over time (middle picture). From the selected RR series, three common methods of HRV analysis can be performed: time domain, nonlinear and frequency domain (three bottom pictures).

