
Fig. 2.
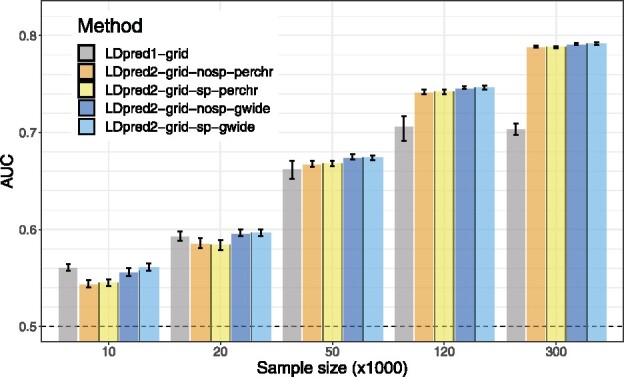
LDpred1-grid is compared to LDpred2-grid when varying GWAS sample size in scenario ‘all_40_3000’. Bars present the mean and 95% CI of 10 000 non-parametric bootstrap replicates of the mean AUC of 10 simulations for each scenario. Corresponding values are reported in Supplementary Table S2