. 2021 Mar 17;10:e67065. doi: 10.7554/eLife.67065

Figure 2. Endocannabinoid-mediated plasticity of OFC transmission to D1 SPNs in Air and CIE mice.

(A) Experimental timeline that includes surgeries followed by four cycles of CIE exposure and whole-cell recordings 3–21 days in withdrawal. (B) Schematic of viral injections in OFC and optical stimulation of OFC terminals during whole-cell recordings of D1 SPNs in the DS. (C) Representative viral expression of ChR2 in OFC. (D) Example ChR2 expression of OFC terminals and expression of tdTomato in D1 SPNs in the DS. (E) Bath application of a CB1 receptor agonist, WIN55212-2 (1 µM), during optical stimulation of OFC terminals to D1 SPNs in Air (n = 6 cells, four mice) and CIE (n = 6 cells, three mice). (F) Bar graphs representing the percentage change from baseline (min 0–10) after bath application of WIN55212-2 (min 30–40). (G) Endocannabinoid mediated long-term depression induced by bath application of a group 1 mGluR agonist, DHPG (50 µM) paired with depolarization to 0 mV in Air (n = 6 cells, three mice) and CIE (n = 5 cells, three mice). (H) Bar graphs representing the percentage change from baseline after bath application of DHPG. (I) DHPG-LTD of OFC transmission is blocked by a CB1 receptor antagonist, SR141716 (1 µM) in both Air (n = 4 cells, three mice) and CIE (n = 6 cells, three mice). (J) Bar graphs representing the percentage change from baseline after bath application of DHPG in the presence of SR141716. (K) D1 agonist (3 µM SKF 81297) blocks the expression of DHPG-LTD in Air mice (n = 6 cells, four mice) but has no effect in mice exposed to CIE (n = 7 cells, five mice; w/ SR141716 n = 5 cells, two mice). (L) Bar graphs representing the percentage change from baseline after bath application of DHPG in the presence of SKF 81297 or SKF 81297 with SR141716. Scale bars represent 10 ms (horizontal) and 50 pA (vertical). Data points and bar graphs represent mean ± SEM. Bonferroni-corrected or paired (vs. baseline) two-tailed t-test, **p≤0.01, ***p≤0.001, ****p≤0.0001.

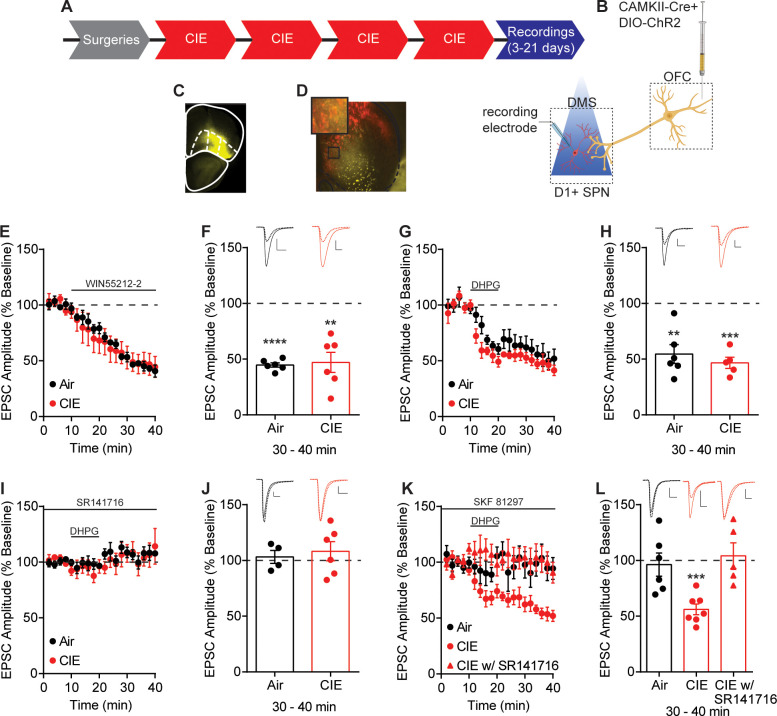
Figure 2—source data 1. Endocannabinoid-mediated plasticity of OFC transmission to D1 SPNs in Air and CIE mice source data.

Figure 2.

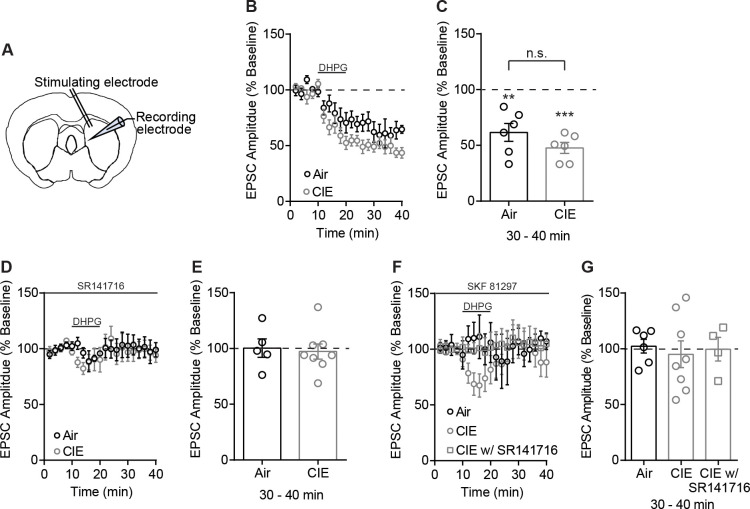
Figure 2—figure supplement 1. No difference between Air and CIE in the expression of DHPG-LTD of electrically evoked EPSCs.

Figure 2—figure supplement 1.

(A) Schematic of local electrical stimulation and recording site in the DS. (B) DHPG-LTD of electrically evoked EPSCs expressed in both Air and CIE mice. (C) Bar graph representing the percentage change from baseline (min 0–10) after bath application of DHPG (min 30–40) (Air: 61.62 ± 8.03% of baseline at 30–40 min, n = 6, paired t-test vs. baseline: t5 = 4.79, p<0.01; CIE: 47.69 ± 4.95% of baseline at 30–40 min, n = 6, paired t-test vs. baseline: t5 = 10.57, p=0.0001; unpaired t-test Air vs. CIE: t10 = 1.48, p=0.17) and (D) DHPG-LTD is blocked by a CB1 receptor antagonist, SR141716 (1 µM). (E) Bar graphs representing the percentage change from baseline after bath application of DHPG in the presence of SR141716 (Air: 100.3 ± 8.27% of baseline at 30–40 min, n = 5, paired t-test vs. baseline: t4 = 0.04, p=0.97; CIE: 97.25 ± 6.87% of baseline at 30–40 min, n = 8, paired t-test vs. baseline: t7 = 0.40, p=0.70). (F) D1 agonist (3 µM SKF 81297) blocks the expression of DHPG-LTD in both Air and CIE. (G) Bar graphs representing the percentage change from baseline after bath application of DHPG in the presence of SKF 81297 or SKF 81297 with SR141716 (Air: 103.6 ± 8.45% of baseline at 30–40 min, n = 4, paired t-test vs. baseline: t3 = 0.43, p=0.70; CIE: 95.11 ± 11.97% of baseline at 30–40 min, n = 8, paired t-test vs. baseline: t7 = 0.41, p=0.70). Short-term depression in CIE mice (74.04 ± 9.88% of baseline at 10–20 min, n = 8, paired t-test vs. baseline: t7 = 2.63, p=0.03) is CB1 receptor dependent (107.10 ± 10.13% of baseline at 10–20 min, n = 4, paired t-test vs. baseline: t3 = 0.70, p=0.53; 99.61 ± 10.58% of baseline at 30–40 min, n = 4, paired t-test vs. baseline: t3 = 0.04, p=0.97). Data points and bar graphs represent the mean ± SEM.
Figure 2—figure supplement 1—source data 1. No difference betwen Air and CIE in the expression of DHPG-LTD of electrically evoked EPSCs.