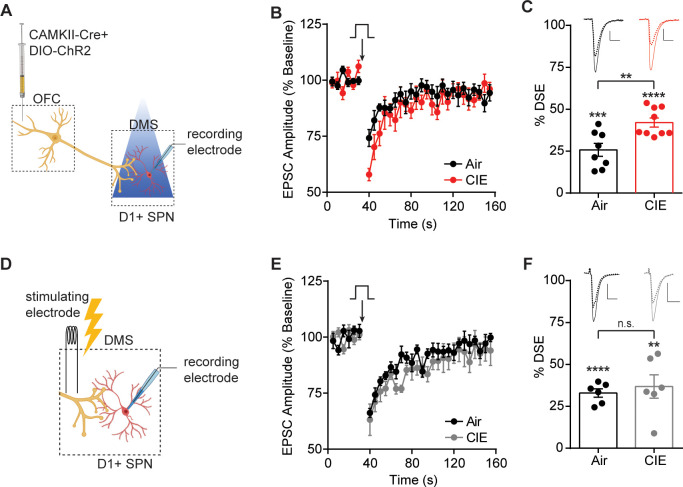
Figure 4. CIE-induced enhancement of DSE at OFC terminals to D1 SPNs in the DS.
(A) Schematic of viral injections in OFC and optical stimulation of OFC terminals during whole-cell recordings of D1 SPNs in the DS. (B) Depolarization-induced suppression of excitation (DSE) of OFC inputs to D1 SPNs in Air (n = 8 cells, three mice) and CIE (n = 9 cells, three mice). (C) Bar graphs representing the percentage change from baseline immediately after depolarization. (D) Schematic of local electrical stimulation during whole-cell recordings of D1 SPNs in the DS. (E) DSE of excitatory inputs to D1 SPNs using electrical stimulation in Air (n = 6 cells, two mice) and CIE (n = 6 cells, three mice). (F) Bar graphs representing the percentage change from baseline immediately after depolarization. Scale bars represent 10 ms (horizontal) and 50 pA (vertical). Data points and bar graphs represent mean ± SEM. Scale bars represent 10 ms (horizontal) and 50 pA (vertical). Unpaired (Air vs. CIE) or paired (vs. baseline) two-tailed t-test, **p≤0.01, ***p≤0.001, ****p≤0.0001.


