. 2021 Mar 31;10:e66960. doi: 10.7554/eLife.66960

Figure 5. Sst interneurons mediate the effect of 5-HT on SOs.

( A) Upstate raster plot during 5-HT and subsequent CNO application. Orange box represents 5-HT, purple boxes represent CNO. Note the appearance of upstates after CNO application. (B) Upstate incidence during 5-HT and 5-HT+CNO application (n = 15; p (baseline vs 5-HT)<10–4, p (baseline vs CNO)=0.0482, p5-HT vs CNO = 0.0405, Kruskal-Wallis test). Patches represent 95% confidence intervals, lines represent standard deviation.

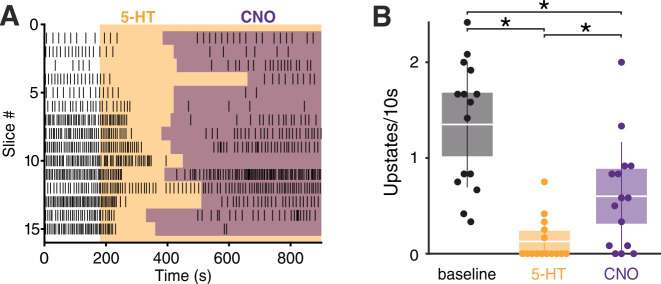
Figure 5—source data 1. Source data for Figure 5B.

Figure 5.

Figure 5—figure supplement 1. CNO application prevents 5-HT mediated upstates suppression.

Figure 5—figure supplement 1.

(A) Upstate raster plot during CNO and subsequent 5_HT application. Orange box represents 5-HT, purple boxes represent CNO. CNO significantly prevents 5-HT-induced suppression of upstates. (B) Upstate incidence during 5-HT, CNO, and 5-HT+CNO application (n = 5, baseline: 1.13 ± 0.13 upstates/10 s, CNO: 1.13 ± 0.10 upstates/10 s, 5-HT: 0.93 ± 0.24 upstates/10 s). Patches represent 95% confidence intervals, lines represent standard deviation.
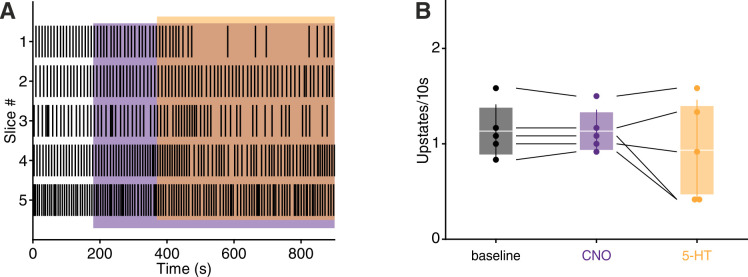
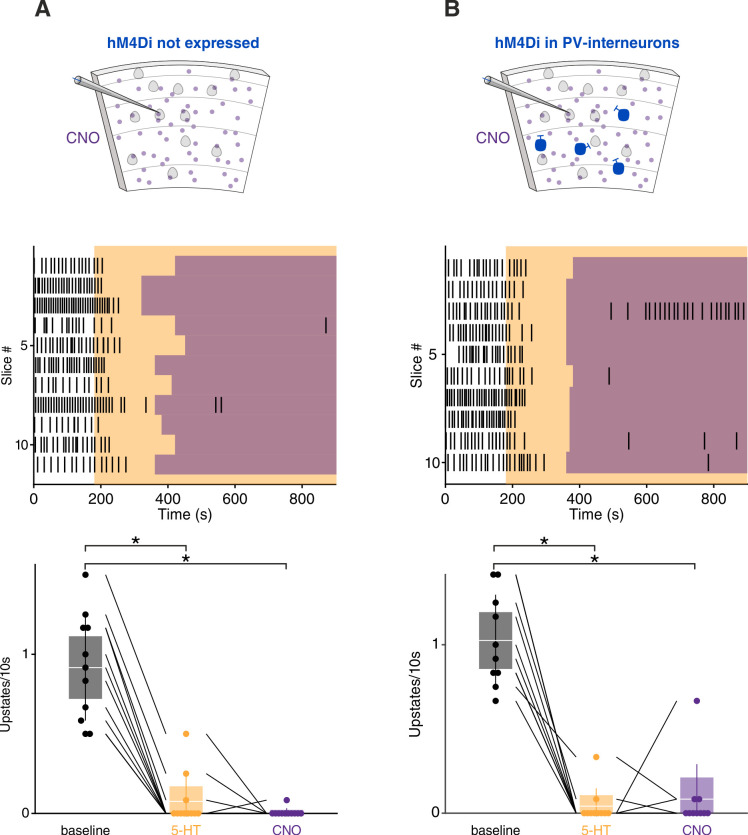
Figure 5—figure supplement 2. CNO application in wild-type littermates and PV-hM4Di mice.

Figure 5—figure supplement 2.

(A) CNO application in wild-type littermates. Top: Experimental protocol. Orange box represents 5-HT and purple boxes represent CNO application. Bottom: upstate incidence during 5-HT and 5-HT+CNO application, patches represent 95% confidence interval, lines represent standard deviation (n = 11 cells in four mice, baseline = 0.91 ± 0.10, 5-HT = 0.09 ± 0.04, CNO = 0.01 ± 0.01, p baseline vs 5-HT = 0.0004, p baseline vs CNO <10−4, Kruskal-Wallis test) (B) Same as (A) but in in PV-hM4Di mice (n = 10 cells in four mice, baseline = 1.02 ± 0.08, 5-HT = 0.04 ± 0.03, CNO = 0.08 ± 0.07, p baseline vs 5-HT < 10−4, p baseline vs CNO = 0.0003, Kruskal-Wallis test).