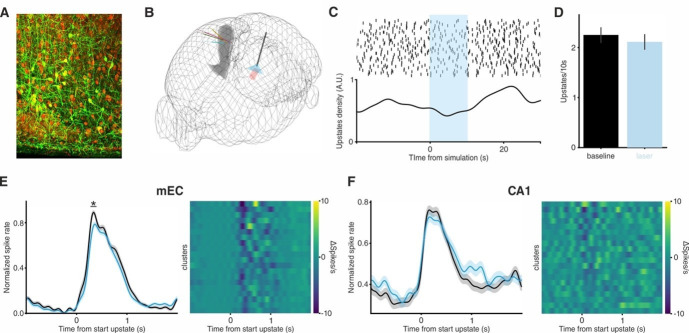
Author response image 1. SO are not suppressed by optogenetic activation of Raphe 5-HT neurons during anesthesia.
(A) DRN immunohistochemistry image showing ChR2-YFP infection in DRN serotonergic neurons. 5-HT in red, YFP in green. Scale bars: 50 µm. (B) 3D visualization of microelectrodes location for all experiments and optic fiber (black) location. EC represented in grey, dorsal Raphe nuclei (DRN) in pink. (C) Top: upstates raster plot. Bottom: upstates density using Gaussian kernel density estimation. (D) Histogram of upstates incidence during baseline and laser stimulation (n animals = 4onedr, baseline: 2.25 ± 0.13 upstates/10s, laser: 2.11 ± 0.14 upstates/10s). (E) Left: normalized spike population activity during baseline (black) and laser stimulation (blue) in mEC L3/5 (n = 108, p < 0.05, unpaired t-test with Holm-Šidák correction). Right: heatmap showing average spike rate difference per cluster between stimulation and baseline during upstates, some units show reduced spiking during stimulation. (F) Left: normalized spike population activity during baseline (black) and laser stimulation (blue) in CA1 (n = 140, p > 0.05, unpaired t-test with Holm-Šidák correction). Right: heatmap showing average spike rate difference per cluster between stimulation and baseline during upstates, no clear difference in spiking activity.

