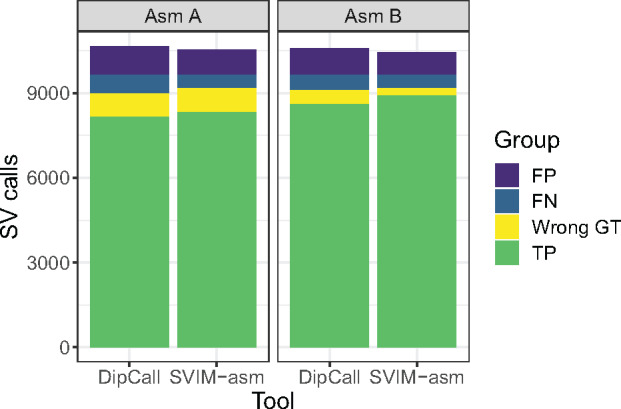
Fig. 1.

Comparison of SV detection and genotyping performance of DipCall and SVIM-asm (x-axis) on two diploid genome assemblies (left panel: Asm A by Wenger et al. and right panel: Asm B by Garg et al., 2020). This stacked barplot shows the number of true positives with correct genotype (green), true positives with wrong genotype (yellow), false negatives (blue) and false positives (violet) as defined by comparing against the GIAB SV benchmark set. For a plot of precision, recall and F1-score, see Supplementary Fig. S3
