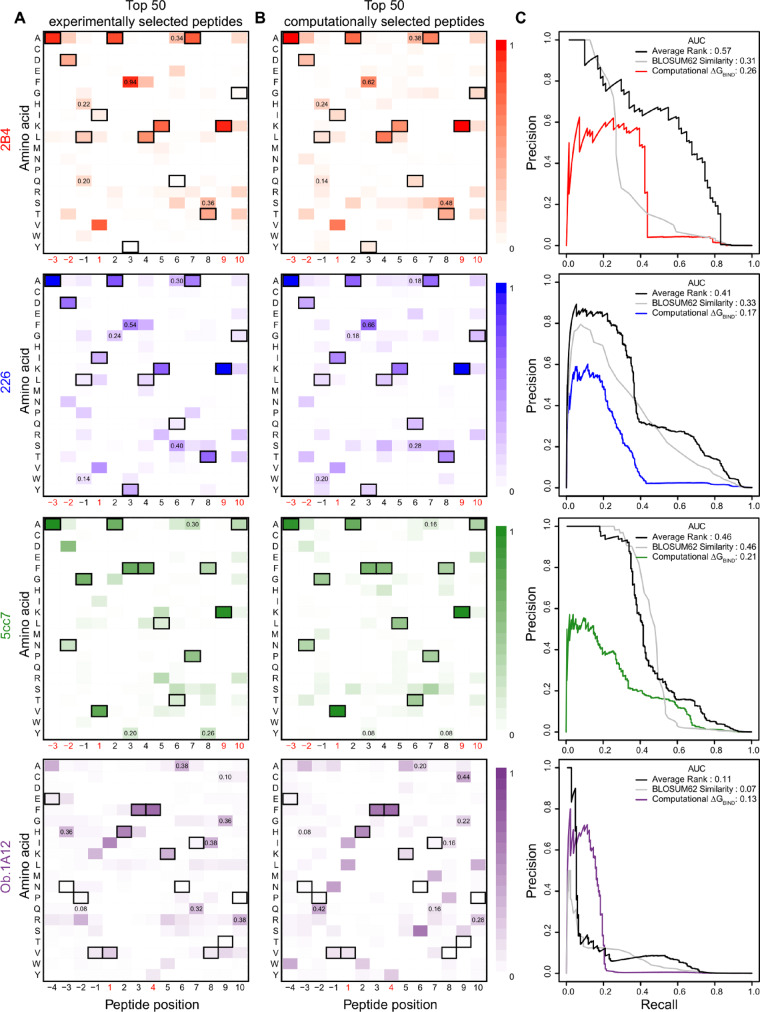
Fig. 3.
Amino acid frequencies for top peptides selected by yeast display or by computation for mouse and human TCRs. (A) Heatmaps represent the amino acid frequencies at peptide positions for the 50 peptides with the most abundant reads in the fourth round of selection for four TCRs (2B4, 226, 5cc7 and Ob.1A12). (B) Amino acid frequencies at peptide positions for the 50 peptides with the most favorable ΔGBIND. The peptide pool for ΔGBIND computation was the union of positive and negative binding sets (>105 peptides). The peptide residues from the template TCR-pMHC structures used for modeling, MCC (for the 2B4 and 226 TCRs), 5c1 (for the 5cc7 TCR) and MBP (for the Ob.1A12 TCR) are outlined in black. Peptide positions restricted in the yeast display libraries to maintain MHC binding are marked in red beneath the heatmap. Shared amino acid substitutions between experimental and computational heatmaps with frequencies two-fold higher than expected are marked by displaying the amino acid frequency at the substitution position. Correlations of frequencies between the experimental and computational heatmap for 2B4, 226, 5cc7 and Ob.1A12 TCRs are 0.91, 0.86, 0.84 and 0.53, respectively (excluding restricted positions). (C) Precision-recall curves assessing binding prediction performance of three methods: (1) computational ΔGBIND, (2) BLOSUM62 sequence similarity to cognate peptide and (3) the average rank of the two methods. Values for the area under the curve (AUC) are displayed in the upper right corner. (Color version of this figure is available at Bioinformatics online.)

