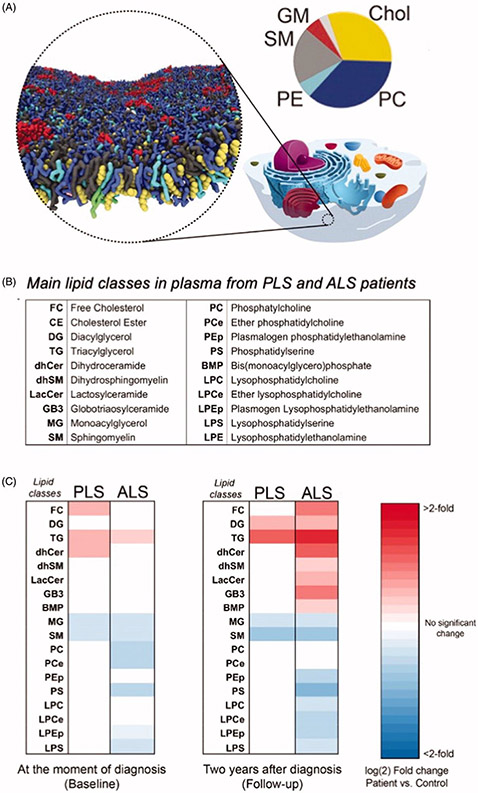
Figure 5.
Pathological changes in the main classes of lipids in plasma from PLS and ALS patients. A. Computer simulation of the spatial distribution of lipids and cholesterol in the outer leaflet of the plasma membrane. Shown are 63 different lipid species, combining 14 types of headgroups and 11 types of tails. Cholesterols are colored yellow, lipid headgroups are colored by type: Phosphatidylcholine PC blue, Sphingomyelin SM gray, Phospatidylethanolamine PE cyan; GM red; Phosphatidylinositolphosphates PIP magenta; Phosphatidylinositol PI pink; Phosphatidylserin PS green; PA, white; CE, ice blue; Diacylglycerol brown; LPC, orange. The pie chart shows the relative distribution of the main lipid in the outer leaflet of the plasma membrane. Modified from (84) with the kind permission of the authors and the publisher. B. Table showing the main classes of lipids in plasma from PLS and ALS patients analyzed by LC-MS. C. Heat map representation of the most significant fold-changes in the concentration of every class of lipids in plasma from ALS and PLS patients compared to controls at the beginning of the study (baseline) and two years after (Follow-up). (n = 40 samples analyzed in triplicate. *<0.05; **<0.01. t-test).

