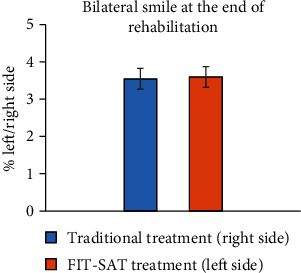
Figure 7.

The graph shows the results between the % right side and the % left side (the Euclidian distances in millimeters between the left/right lip corner marker and the nose marker, Figure 3(b)) at the first acquisition (T1, blue) and at the last acquisition (T2, orange), respectively. Error bars represent SE (standard errors of the means).
