
Figure 1.
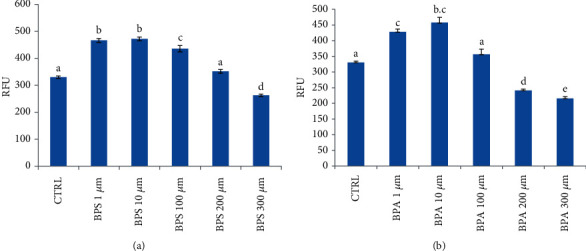
ROS production in sheep erythrocytes treated with BPS (a) and BPA (b) (1-300 μM). All fluorescence measurements (RFU) after 4 hours of treatment were corrected for background fluorescence, and excitation and emission wavelengths were 485 and 535 nm, respectively. CTRL were cells treated with methanol. Statistical Analysis Data are expressed as mean ± SEM of at least 4 replicates. Results were analyzed by a monofactorial ANOVA (Minitab® 18.1). Statistical significance was accepted at p < 0.05.