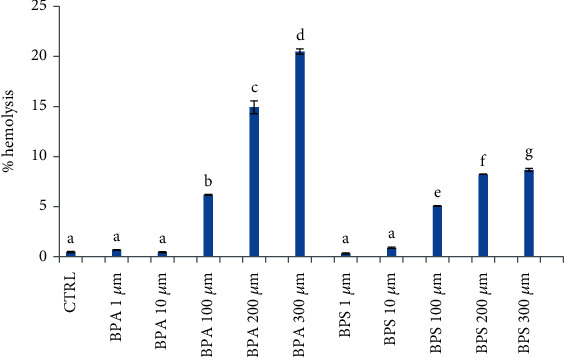
Figure 3.

RBC hemolysis percentage after incubation with BPA and BPS at concentrations of 1, 10, 100, 200, and 300 μM; CTRL were cells treated with methanol. Statistical Analysis Data are expressed as mean ± SEM of at least 4 replicates. Results were analyzed by a monofactorial ANOVA (Minitab® 18.1). Lowercase letters indicate significant differences between groups (p < 0.01).
