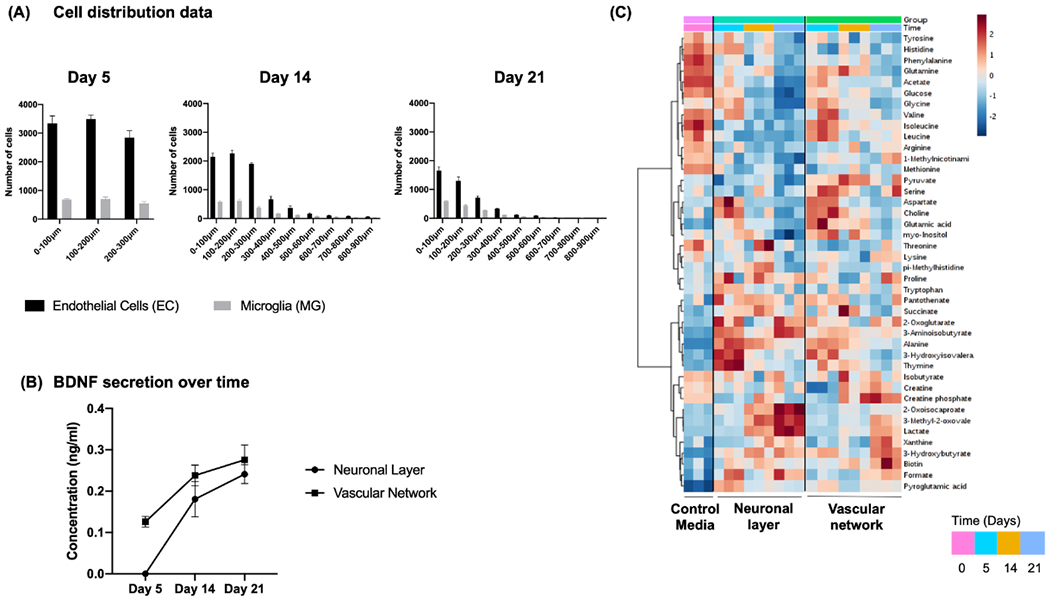
Figure 3.

Characterization of PNVP model at day 5, 14, and 21. A) The distribution of endothelial cells and microglia at every 100 μm intervals within PNVP model at day 5, 14, and 21. B) BDNF secretion over time by neuronal layer and vascular network within the neuronal and vascular chamber, respectively. C) Heatmap showing the metabolic profiles of neuronal layer and vascular network analyzed at day 0, 5, 14, and 21. Heatmap was generated by hierarchical clustering using Pearson correlation as a distance measurement and Ward clustering algorithm. Legend shows auto scaled values from 2 to −2 assigned to the relative metabolite concentrations. Individual metabolites are shown in the rows and group averages are shown in the columns of the heatmap.
