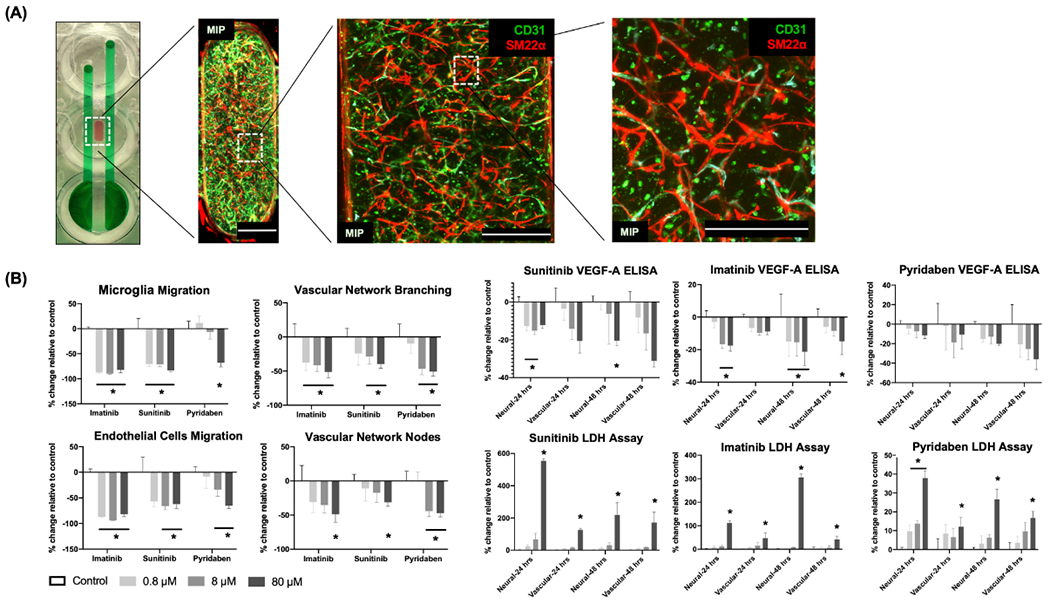
Figure 4.

Vascular network characterization and effects induced by vascular disruptors. A) At day 5, standard fixation and immunostaining protocols characterized the formation of vascular network within the vascular chamber of a device in the microfluidics plate by labeling endothelial cells and pericytes with CD31 expression (green) and SM22α (red). Samples were imaged in 3D with confocal microscopy and displayed as maximum intensity projections (MIPs). Scale bars: 500 μm. B). At day 16, concentration-dependent toxicity profiles (endothelial cells migration, microglia migration, vascular network branching and nodes, VEGFA secretion, and LDH release in neural (or, neuronal) and vascular chambers) were measured as percent change, compared to vehicle controls. Vascular disruptors (Imatinib, Sunitinib, and Pyridaben) were added at low (0.8 × 10⁻⁶ M), medium (8 × 10⁻⁶ M), and high (80 × 10−6 M) concentrations for two days. Data are plotted as mean ± SEM and analyzed using a two-way ANOVA followed by Dunnett’s post hoc test. Statistical significance is indicated by * for p < 0.05.
