
Figure 4.
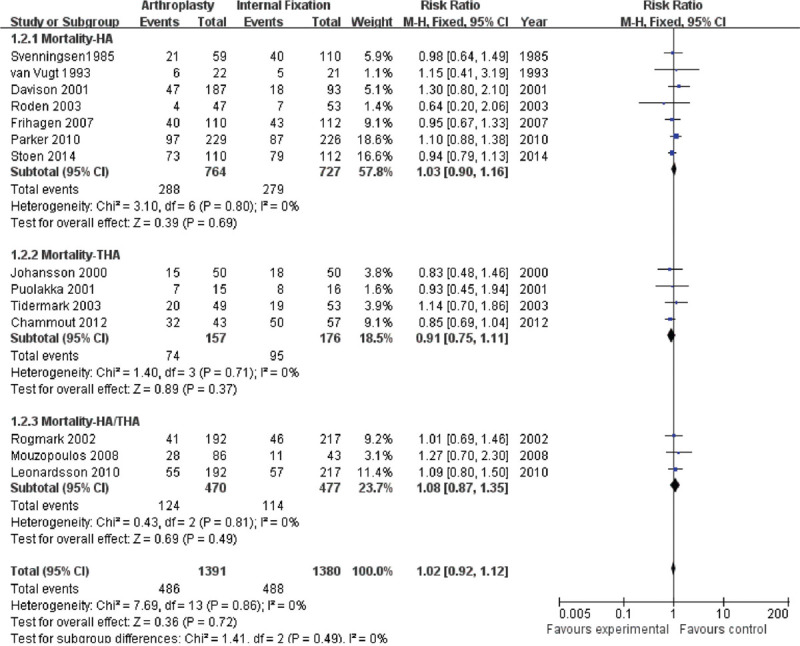
Forest plot of comparison of mortality at long term including the subgroups of Mortality-HA, Mortality-THA, and Mortality-HA/THA. Experimental = Arthroplasty, Control = Internal Fixation, M-H = Mantzel-Haenzel method.
Official websites use .gov
A
.gov website belongs to an official
government organization in the United States.
Secure .gov websites use HTTPS
A lock (
) or https:// means you've safely
connected to the .gov website. Share sensitive
information only on official, secure websites.
Forest plot of comparison of mortality at long term including the subgroups of Mortality-HA, Mortality-THA, and Mortality-HA/THA. Experimental = Arthroplasty, Control = Internal Fixation, M-H = Mantzel-Haenzel method.