FIGURE 3.

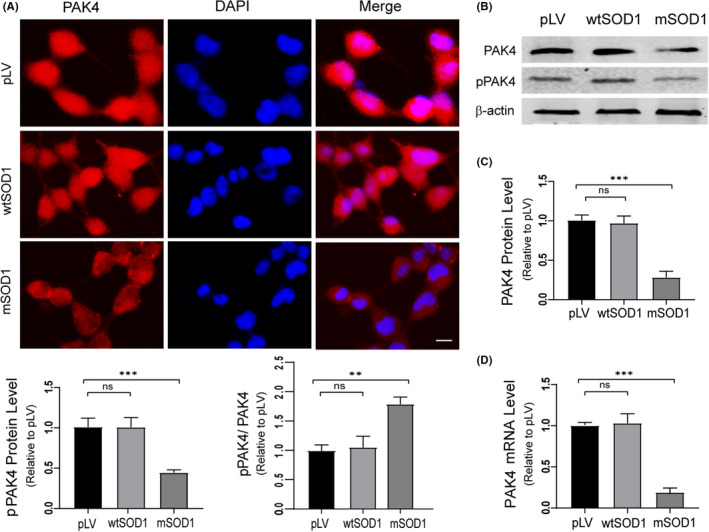
Reduced expression of PAK4 is identified in mSOD1 cells. A, Confocal microscopy images of PAK4 (red) in pLV, wtSOD1 and mSOD1 cells, respectively. The weakest intensity of PAK4 staining was observed in mSOD1 cells, while similar intensities were seen in wtSOD1 and pLV cells. Scale bar = 50 μm. B, Immunoblotting analysis of PAK4 and pPAK4 protein expression levels was conducted with lysates from control pLV, wtSOD1 and mSOD1 cells. C, Quantification of PAK4 and pPAK4 blots in (B) normalized to β‐actin. Relative PAK4 and pPAK4 protein levels were significantly decreased in mSOD1 cells. pPAK4/PAK4 ratio was highest in mSOD1 cells. D, qRT‐PCR analysis detected the mRNA expression of PAK4. For relative quantification of PAK4 mRNA expression, the 2−ΔΔCt method was conducted using β‐actin for normalization; data were provided as means ± SD. ANOVA with Student‐Newman‐Keuls post hoc analysis was used to evaluate statistical significance, ns ≥ .05, *P < .05, **P < .01, ***P < .001
