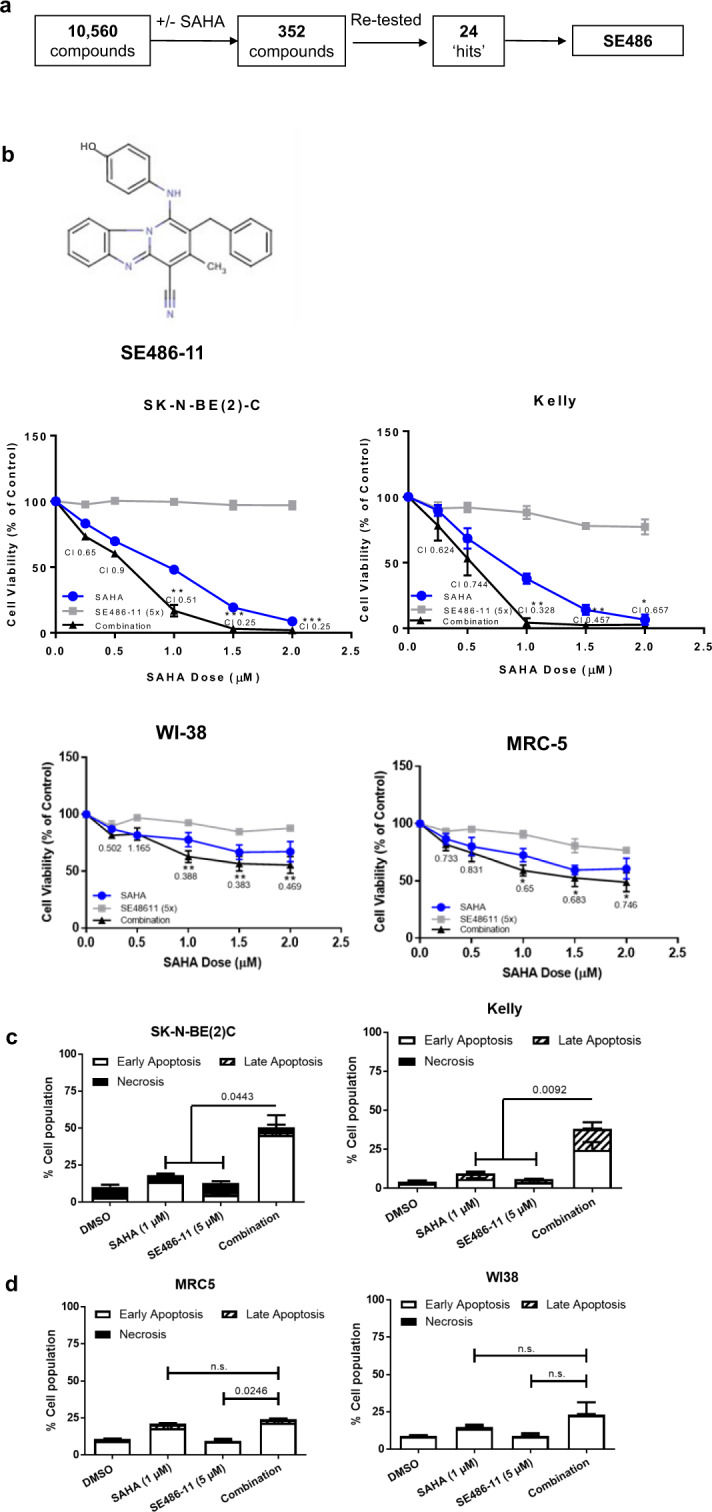
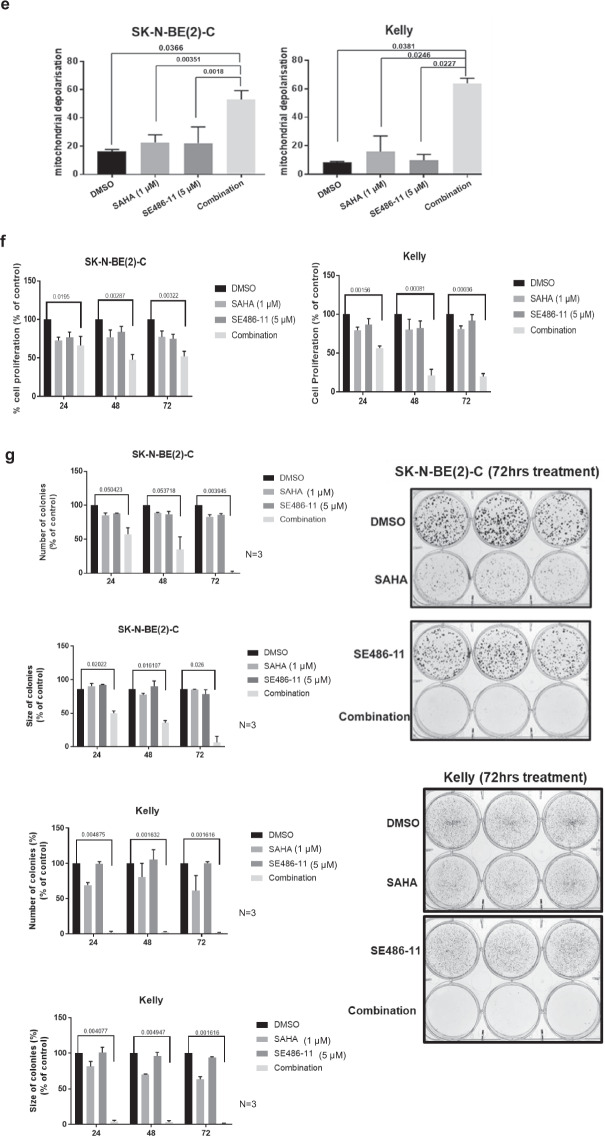
Fig. 1. Combinatorial drug screening identified a novel compound that synergistically enhanced the cytotoxicity of suberanoyl hydroxamic acid (SAHA).

a The steps in screening process of 10,560 compounds from the Walter and Eliza Hall Institute (WEHI) diverse compound library on the SAHA-resistant MDA-MB-231 breast cancer cell line. This identified 24 hits that showed less than 40% viability when used in combination with SAHA, but greater than 70% cell viability when used alone. b Top panel: The chemical structure of the identified hit compound, SE486-11. Lower panel: The cell viability of neuroblastoma SK-N-BE(2)-C and Kelly cells, and human fibroblasts WI-38 and MRC-5 cells were measured by Alamar Blue assays after treatment with DMSO, SAHA, SE486-11, or the combination, at different concentrations (SAHA: SE486-11 ratio: 1:5) for 72 h. The cell viability was calculated and displayed as the percentage of DMSO control for single agents and the combination. The resulting combination index (CI) theorem of Chou–Talalay showed quantitative definition for additive effect (CI = 1), synergism (CI < 1), and antagonism (CI > 1) in drug combinations [42]. Significance was determined from three independent experiments. c Apoptotic and necrotic effects of the single agents and combination treatment was determined following pre-treatment of SK-N-BE(2)-C and Kelly neuroblastoma cells for 72 h before collecting the cells and staining with Annexin V/7-AAD and loss of staining was detected by FACS analysis. A summary of results is shown as the percentage of cells in early or late apoptosis, and necrosis as histograms. Significance was determined from three independent experiments. d Apoptotic and necrotic effects of the single agents and combination treatment was determined following pre-treatment of MRC-5 and WI-38 cells for 72 h before collecting the cells and staining with Annexin V/7-AAD and loss of staining was detected by FACS analysis. e The mitochondrial polarisation of SK-N-BE(2)-C and Kelly cells after 48 h of treatment with DMSO, single agents or combination therapy was determined using the JC-1 assay. Cells were collected and stained with JC-1 dye and the mitochondrial membrane potential determined following FACS analysis. The bar graph indicates the averaged data, mean ± SD, as the percentage of cells with lowered red fluorescence, measuring mitochondrial depolarisation. Significance (**p < 0.01) was determined from at least three independent experiments. f Effect of DMSO, single agents, and combination therapy (1 µM SAHA + 5 µM SE486-11) on cellular proliferation of SK-N-BE(2)-C and Kelly neuroblastoma cell lines after 24, 48, and 72 h of treatment was determined by measuring BrdU incorporation. Data are presented as mean ± SD percentage of cell proliferation after normalisation to the control untreated cells. Significance (*p < 0.001, **p < 0.0001) was determined from at least three independent experiments. g In vitro clonogenic growth assay performed in SK-N-BE(2)-C and Kelly cells by counting the number of colonies and the sizes of colonies after 21 days post cell plating and treatment with DMSO, single agents and combination therapy (1 µM SAHA + 5 µM SE486-11). Histogram represents mean ± SD of the number of colonies after 24, 48, and 72 h of treatment and growing for 21 days. The significance (*p < 0.01, **p < 0.0001; ***p < 0.00001) was determined after three independent experiments. Representative examples of stained colonies are shown for each treatment in both cell lines.

