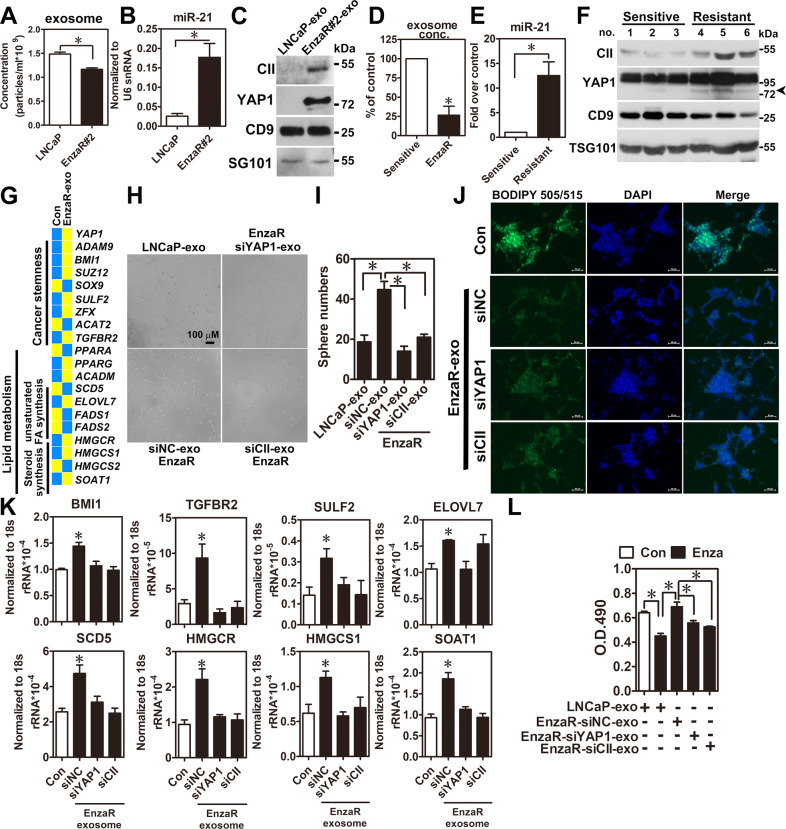
Fig. 7. Increase of COUP-TFII/miR-21/YAP1 regulation axis in the EVs isolated from EnzaR cells and clinical specimens contributes to development of enzalutamide resistance.
A Conditioned media from LNCaP parental and EnzaR cells were isolated EVs by size exclusion chromatography. Size and concentration of EVs were further analyzed by nanoparticle tracking analysis (NTA) (n = 3). B, C miR-21, COUP-TFII, and YAP1 expression levels were individually determined in EVs isolated from LNCaP parental and EnzaR cells by RT-qPCR (n = 3) and western blot. D Concentrations of EVs-isolated from sera of enzalutamide-sensitive and -resistant patients were determined by NTA analysis (n = 3). Results were presented as percentage of control. E, F miR-21, COUP-TFII, and YAP1 expression levels were individually determined in EVs isolated from sera of enzalutamide-sensitive and -resistant patients RT-qPCR (E) (n = 3) and western blot (F). G Heatmap showed the expression profiles of genes related to cancer stemness and lipid metabolism in LNCaP cells treated with EnzaR-EVs (10 μg) for 48 h. H, I LNCaP cells were treated with control (siNC), YAP1-, or CII-depleted EnzaR-EVs (10 μg) for 12 days for sphere culture (n = 3). Representative pictures and quantifications of sphere numbers were respectively shown in the H, I. J LNCaP cells treated with EnZaR-EVs derived from siNC, siYAP1, and siCII in EnzaR cells for 48 h were performed lipid staining by BODIPY 505/515 dye. K LNCaP cells were treated with control (siNC), YAP1-, or CII-depleted EnzaR-EVs (10 μg) for 48 h. Expression levels of cancer stemness-related genes such as BMI1, CDK6, TGFBR2, and SULF2 were determined by RT-qPCR (n = 3). L LNCaP cells were co-treated with enzalutamide (10 μM) and LNCaP-EVs or control (siNC), YAP1-, or CII-depleted EnzaR-EVs (10 μg) for 72 h to perform cell proliferation assays (n = 3). Asterisk indicates p < 0.05 using two-tailed Student’s t-test for above experiments.

