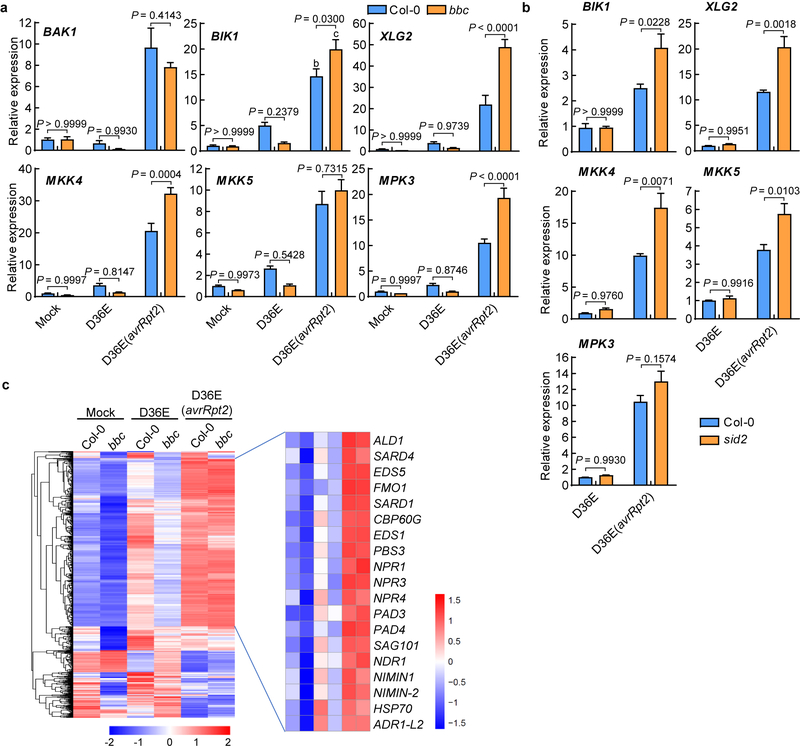
Extended Data Fig. 10|. Up-regulation of key PTI component genes by AvrRpt2-triggered ETI seems to be independent of PTI and SA/NHP.
a, qRT-PCR results of representative PTI pathway genes. Col-0 and bbc plants were infiltrated with different strains indicated, and leaves were harvested 3h post infiltration for transcript analysis (mean ± s.e.m; n = 3 biological replicates for all plants/genes, except “bbc-BAK1”, for which n = 4 biologically independent samples). Statistical analysis by two-way ANOVA with Tukey’s test. P-values for additional comparisons are provided in Supplementary Table 3. b, qRT-PCR analysis of BIK1, XLG2, MKK4, MKK5 and MPK3 expression levels in Col-0 and sid2 plants 3h after infiltration with D36E or D36E(avrRpt2). Statistical analysis by two-way ANOVA with Tukey’s test (mean ± s.e.m.; n = 3 (for Col-0) or 4 (for sid2) biologically independent samples). These experiments were repeated at least three times with similar trends. c, Heat-maps of NHP-responsive genes (extracted from Hartmann et al., 201844, defined by genes that are responsive to pipecolic acid and depend on FMO1 for expression) in the Col-0 and bbc plants in our RNAseq experiment.

