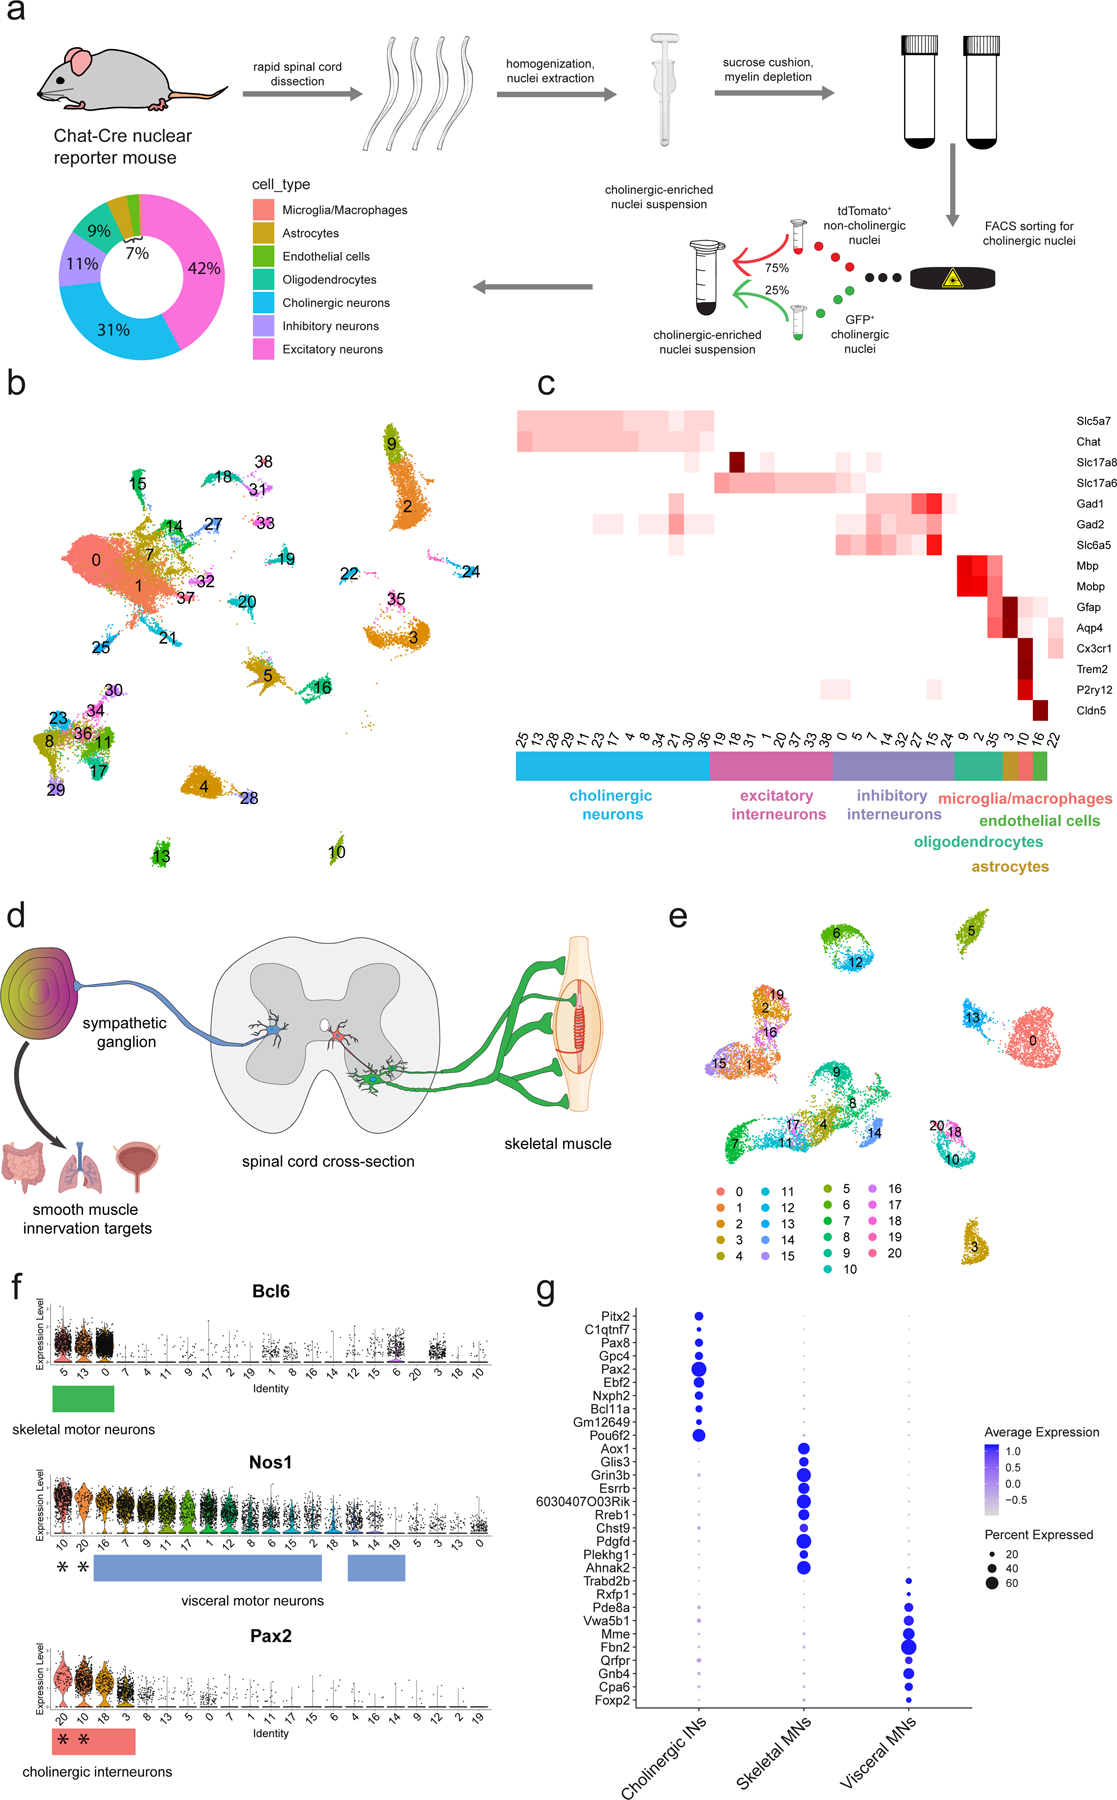
Fig. 1: Motor neuron enrichment and single-nucleus transcriptional analysis of the adult mouse spinal cord uncovers novel skeletal and visceral motor neuron markers.

a, Workflow for cholinergic nucleus enrichment and single-nucleus RNA sequencing (snRNAseq)—GFP+ and TdTomato+ cells were mixed at a ratio between 1:3 and 2:3. Plot shows the distribution of canonical cell types with their proportional representation. FACS was used to select appropriate proportion of singlet, DAPI+/GFP+/tdTomato− nuclei. b, UMAP of clustered snRNAseq data from 43,890 transcriptomes. c, Average expression levels per cluster for marker genes of each canonical cell population. Cell type labels based on expression patterns of marker genes. d, Schematic depicting expected cholinergic cell types in the spinal cord. Visceral motor neurons (blue) innervate sympathetic ganglia, skeletal motor neurons (green) directly innervate muscle fibers, and cholinergic interneurons (red) innervate motor neurons and other cells. e, UMAP with graph-based clustering of all cholinergic neurons reveals 21 clusters. f, Ranked expression of known marker genes Pax2 (interneurons) and Nos1 (visceral motor neurons), as well as novel marker gene Anxa4 (skeletal motor neurons) by cluster. Cell labels were assigned hierarchically by expression levels of Pax2, Nos1, and Bcl6 and are reported below each plot. Cholinergic interneuron clusters that also express Nos1 are denoted with a (*). g, Enriched differentially expressed genes for cholinergic interneurons, skeletal motor neurons, and visceral motor neurons. Dot size is proportional to the percent of each cluster expressing the marker gene, while blue color intensity is correlated with expression level. All expression values were log-normalized in Seurat50.
