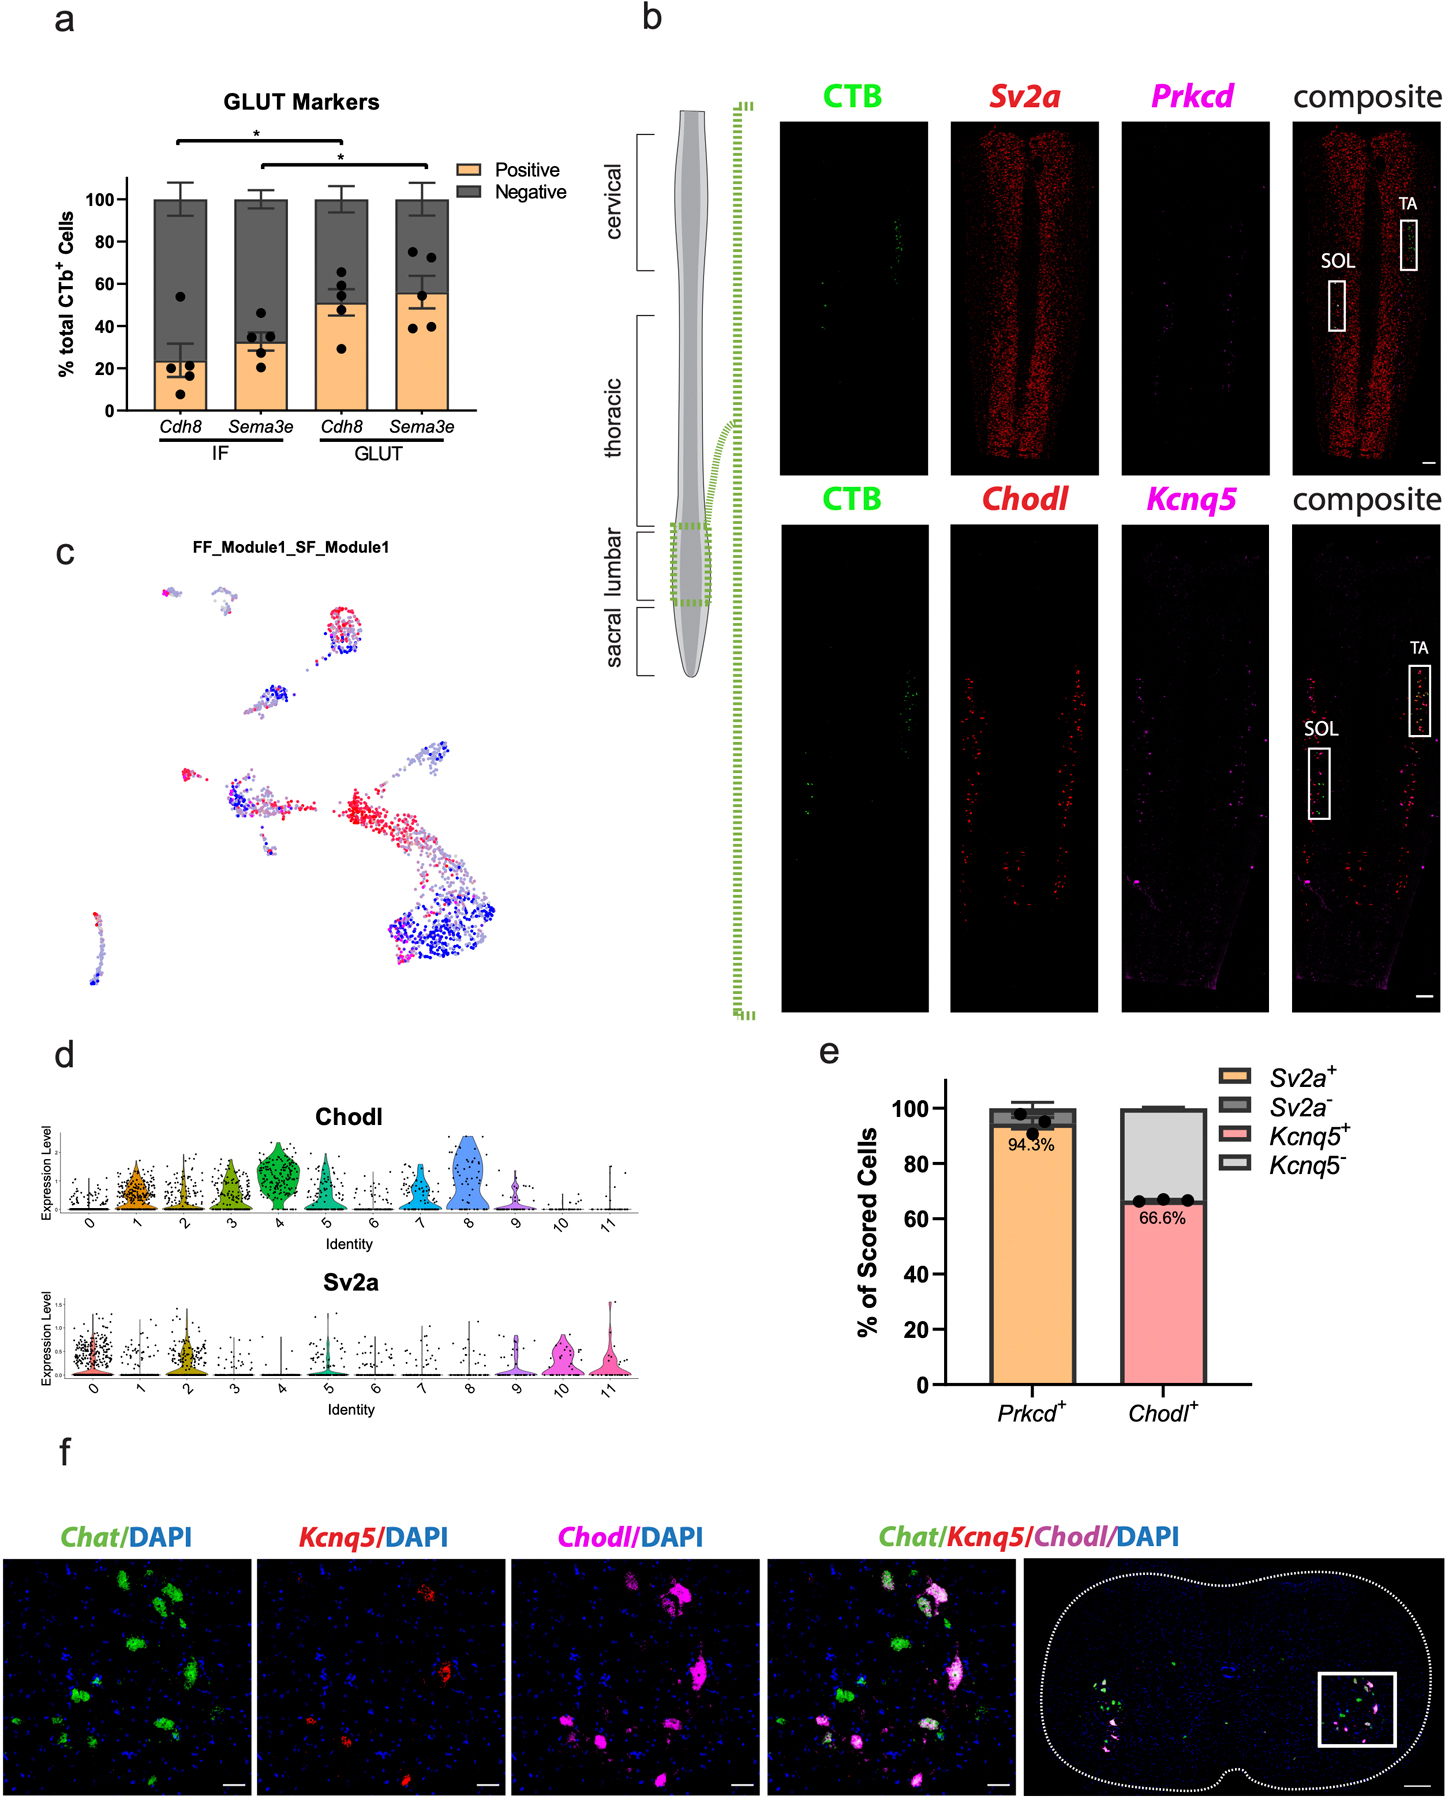
Extended Data Fig. 6. Retrograde CTB labeling of motor pools connects transcriptional subpopulations with motor pools.

a, Proportion of CTB-labeled cells from GLUT and IF that are labeled with Cdh8 and Sema3e. The GLUT has a significantly larger proportion of Cdh8+ and Sema3e+ cells than the IF. n=5 biologically independent animals. b, Lower power view of in situ hybridization against Prkcd/Sv2a, and Kcnq5/Chodl (insets=Fig. 4h) in longitudinal sections demonstrates the specificity of CTB injections into the Soleus (SOL) and Tibialis anterior (TA). n=5 (TA) and 4 (SOL) biologically independent animals. One-way ANOVA with post-hoc Sidak multiple comparison test between same-gene conditions. Adjusted p-values=0.0212 (Cdh8) and 0.0499 (Sema3e). c, Expression of FF and SF gene modules overlaid on UMAP of all α motor neurons. d, Average log-normalized canonical marker expression of Chodl (fast-firing) and Sv2a (slow-firing). Scale bars = 250 µm. e, Proportion of Prkcd+ cells positive for Sv2a (left) and proportion of Chodl+ cells that are positive for Kcnq5 (right). n=3 biologically independent animals. f, Representative in situ hybridization showing Kcnq5 is expressed in a subset of Chodl+ cells. n=4 biologically independent animals. Scale bar=50 µm inset and 200 µm overview. *=p value<0.05, **=p value <0.01, ***=p value<0.001, ****=p value<0.0001. Error bars are SEM.
